

Question: I need the answer to #10 based on information on #9 withir Garcia warral report 10. Using the data from Problem 9, continue your analysis
I need the answer to #10 based on information on #9 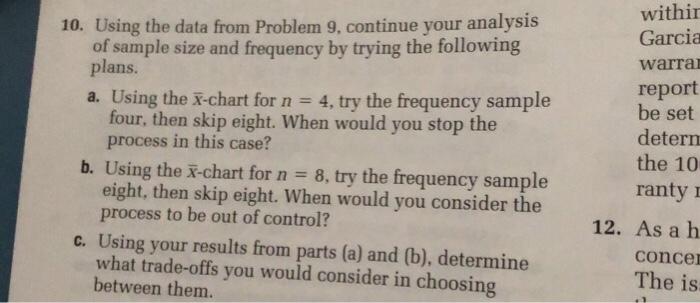
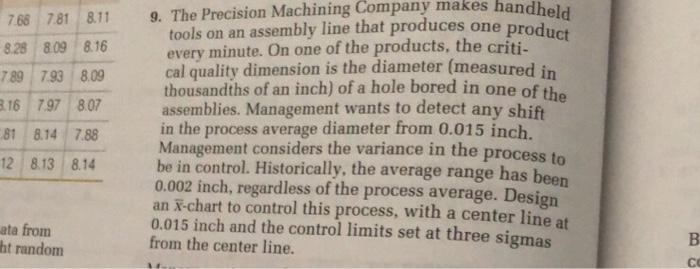
withir Garcia warral report 10. Using the data from Problem 9, continue your analysis of sample size and frequency by trying the following plans. a. Using the x-chart for n = 4, try the frequency sample aX- four, then skip eight. When would you stop the process in this case? b. Using the X-chart for n = 8, try the frequency sample eight, then skip eight. When would you consider the process to be out of control? be set detern the 10 ranty 12. As a h conces The is c. Using your results from parts (a) and (b), determine what trade-offs you would consider in choosing between them. 7.68 7.818.11 product 8.28 809 8.16 789 793 8.09 16 797 8.07 9. The Precision Machining Company makes handheld tools on an assembly line that produces one every minute. On one of the products, the criti- cal quality dimension is the diameter (measured in thousandths of an inch) of a hole bored in one of the assemblies. Management wants to detect any shift in the process average diameter from 0.015 inch. Management considers the variance in the process to be in control. Historically, the average range has been 0.002 inch, regardless of the process average. Design an X-chart to control this process, with a center line at 0.015 inch and the control limits set at three sigmas from the center line. 81 8.14 7.88 12 8.13 8.14 ata from ht random U B Step by Step Solution
There are 3 Steps involved in it
1 Expert Approved Answer
Step: 1 Unlock

Question Has Been Solved by an Expert!
Get step-by-step solutions from verified subject matter experts
Step: 2 Unlock
Step: 3 Unlock