

Question: 100% + EB A View Zoom Add Page Insert Table Chart Text t Shape Media Comment Collaborate Format Document 4. The following graphs were generated

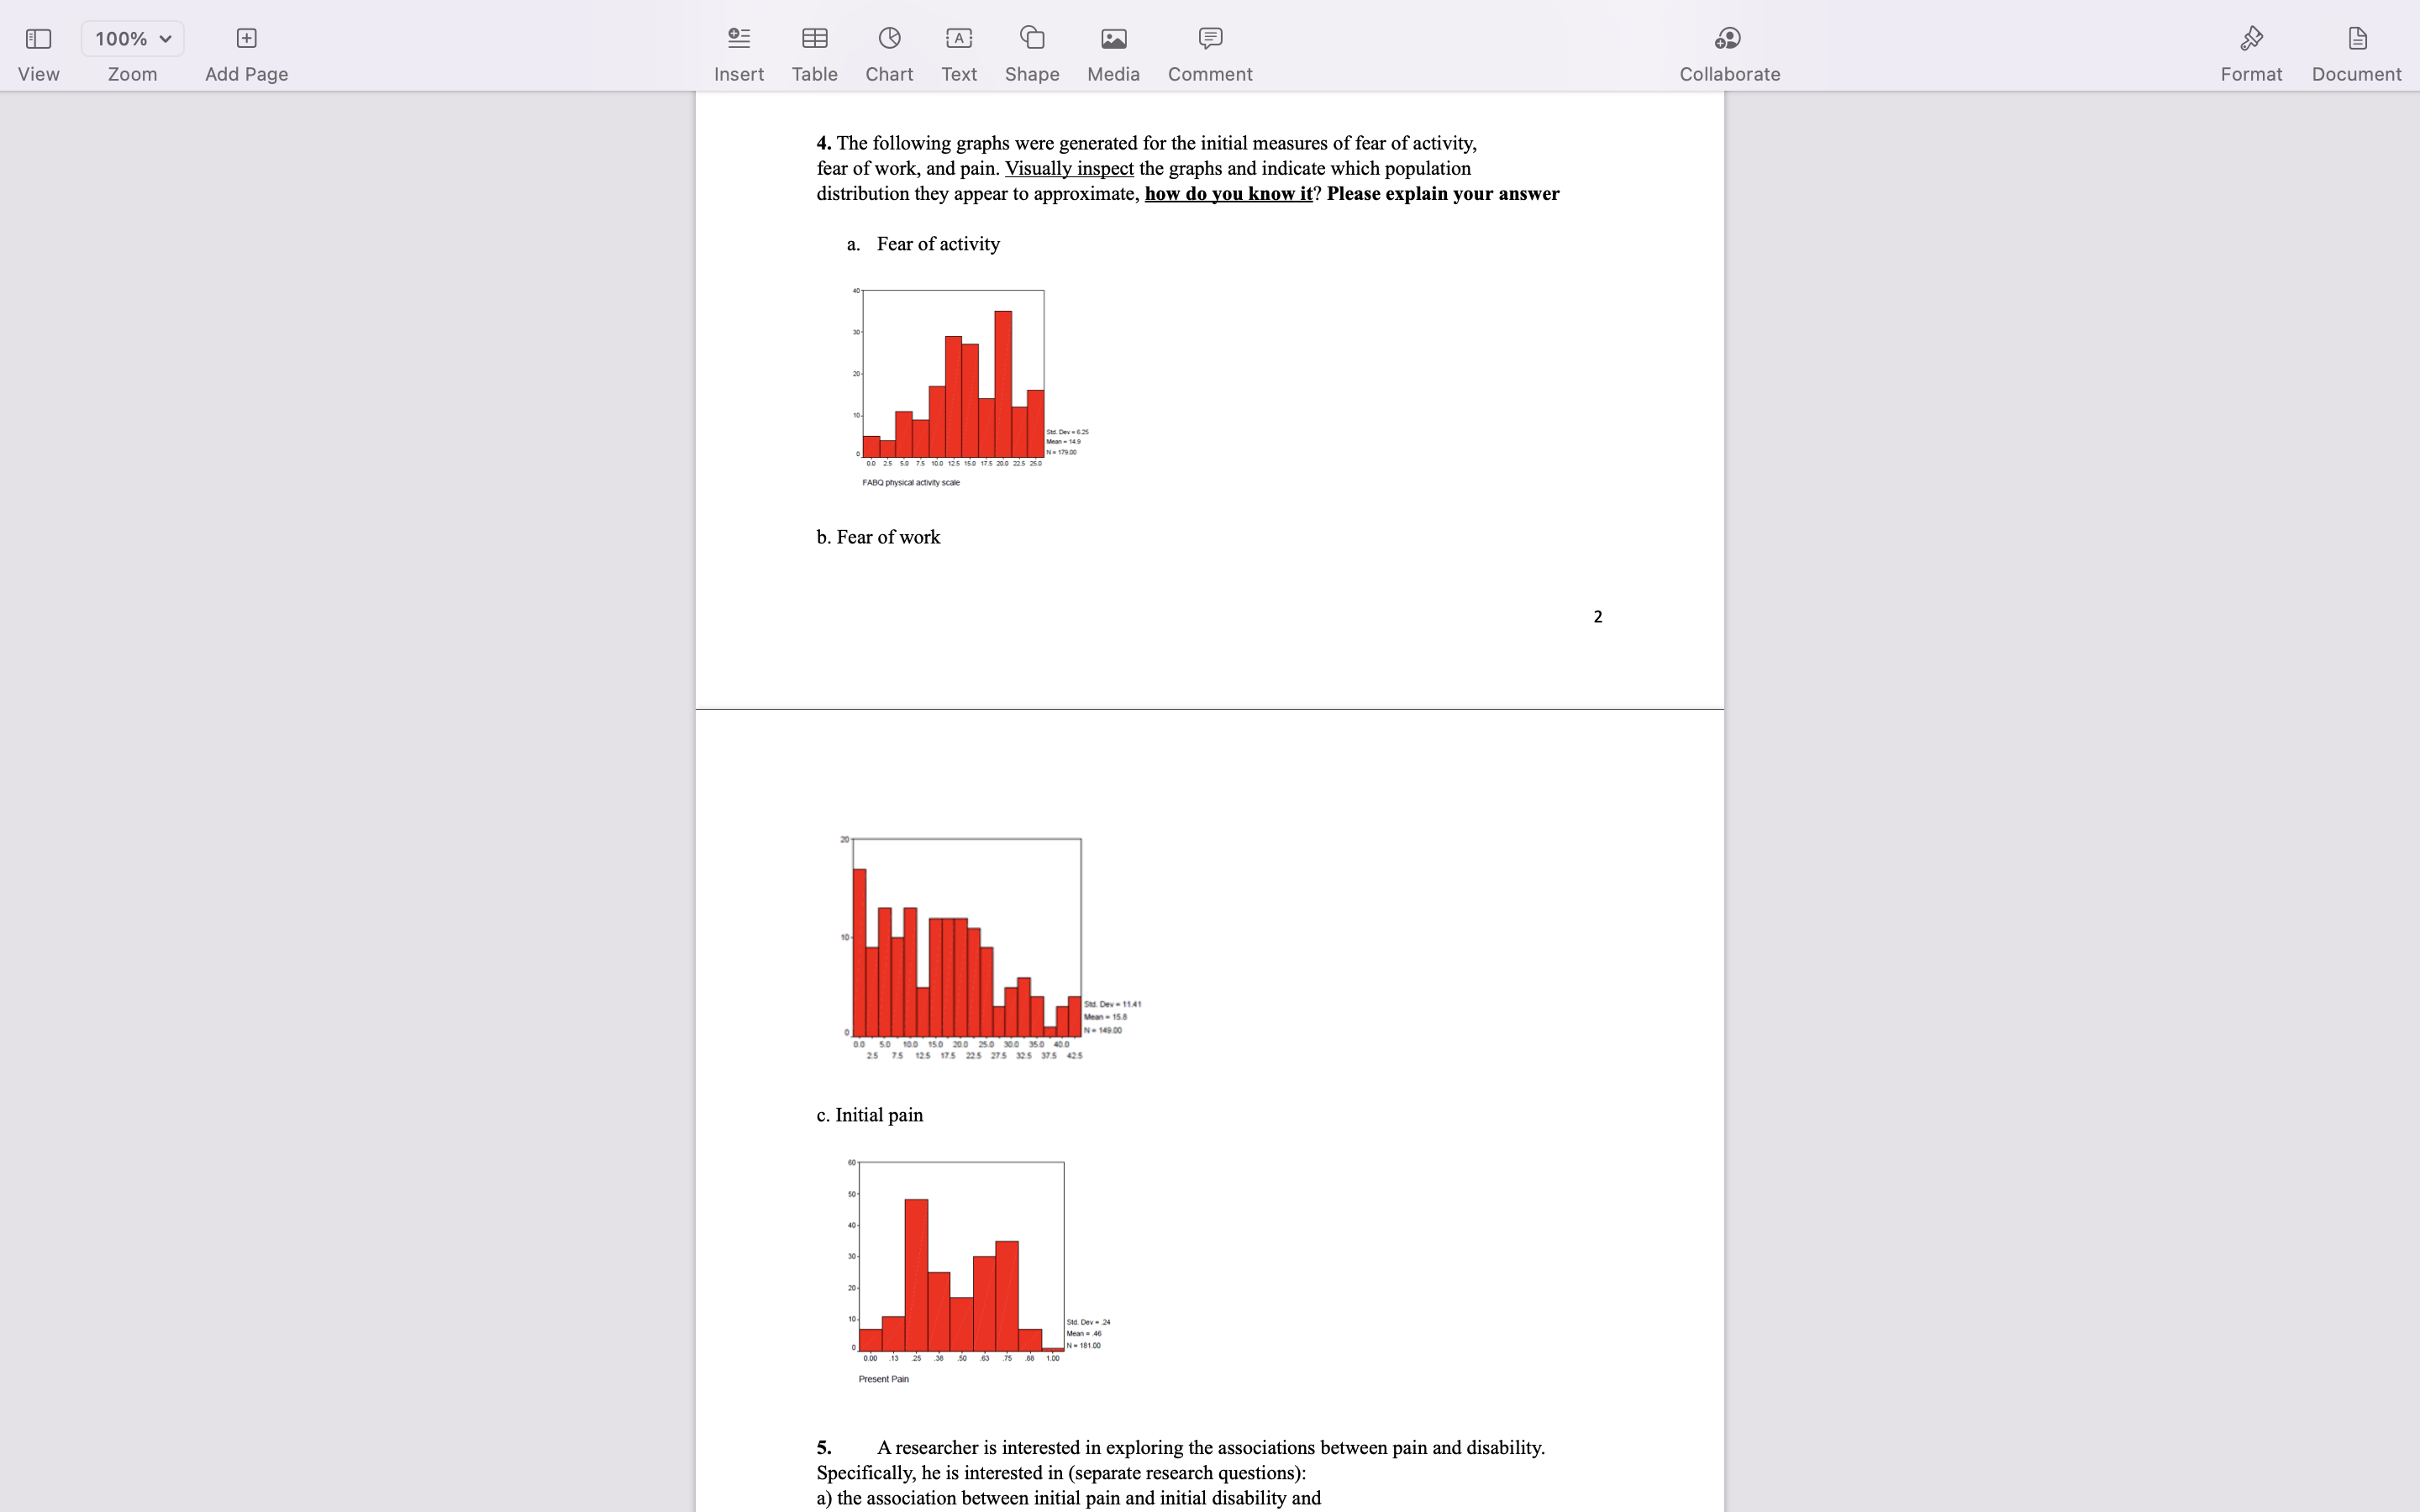
100% + EB A View Zoom Add Page Insert Table Chart Text t Shape Media Comment Collaborate Format Document 4. The following graphs were generated for the initial measures of fear of activity, fear of work, and pain. Visually inspect the graphs and indicate which population distribution they appear to approximate, how do you know it? Please explain your answer a. Fear of activity 0 25 50 75 100 125 150 175 200 225 260 FABQ physical activity scale b. Fear of work 2 25 0 75 125 175 225 275 325 375 425 c. Initial pain Stad Dev - 24 Present Pain 5. A researcher is interested in exploring the associations between pain and disability. Specifically, he is interested in (separate research questions): a) the association between initial pain and initial disability and
Step by Step Solution
There are 3 Steps involved in it

Get step-by-step solutions from verified subject matter experts