

Question: 11. Based on the autarky points A and A' in Figure 3-7, draw a figure showing the production and consumption points for the UK and
11. Based on the autarky points A and A' in Figure 3-7, draw a figure showing the production and consumption points for the UK and the USA, if the trade is done over Pc/Pw = 1. Is this the equilibrium price reached as a result of trade? Why? How much does each country gain from trade?
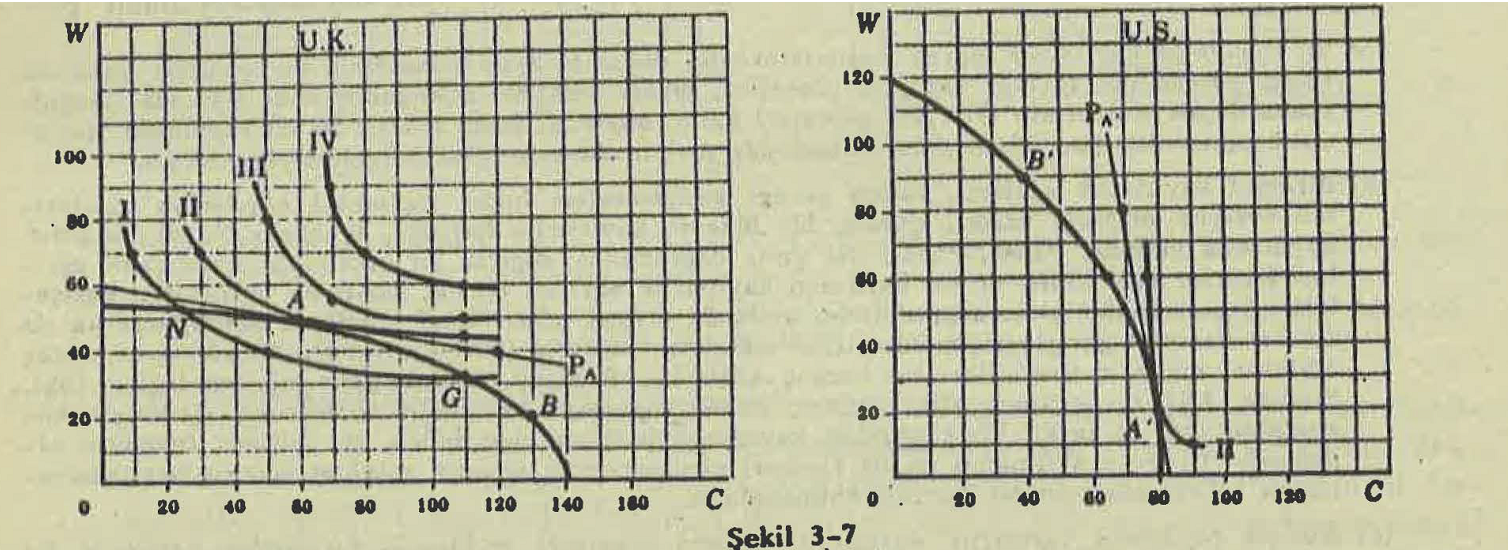
W U.K. W 120 IV 100 80 60 40- 20 0 100 B 80 60 40 PA B 20 U.S. 20 40 60 80 100 120 140 180 C 20 40 60 80 100 130 C ekil 3-7
Step by Step Solution
There are 3 Steps involved in it
1 Expert Approved Answer
Step: 1 Unlock

Question Has Been Solved by an Expert!
Get step-by-step solutions from verified subject matter experts
Step: 2 Unlock
Step: 3 Unlock