

Question: 11. Visualizing fuel efficiency The dotplot shows the difference (Highway - City) in EPA mileage ratings for each of the 21 model year 2020 midsize

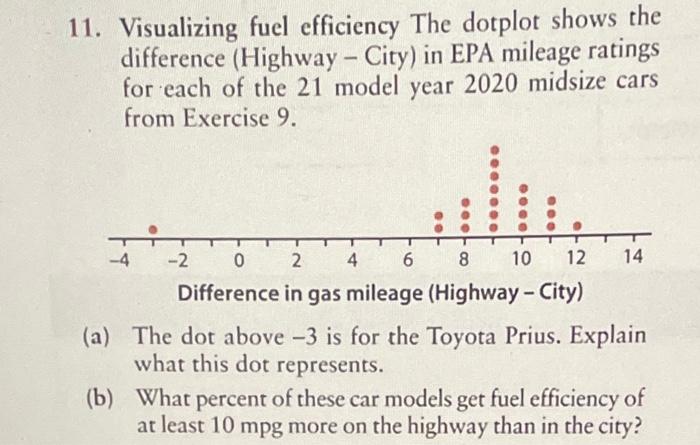
11. Visualizing fuel efficiency The dotplot shows the difference (Highway - City) in EPA mileage ratings for each of the 21 model year 2020 midsize cars from Exercise 9. .. . . . .. ... -2 0 2 4 6 8 10 12 14 Difference in gas mileage (Highway - City) (a) The dot above -3 is for the Toyota Prius. Explain what this dot represents. (b) What percent of these car models get fuel efficiency of at least 10 mpg more on the highway than in the city
Step by Step Solution
There are 3 Steps involved in it
1 Expert Approved Answer
Step: 1 Unlock

Question Has Been Solved by an Expert!
Get step-by-step solutions from verified subject matter experts
Step: 2 Unlock
Step: 3 Unlock