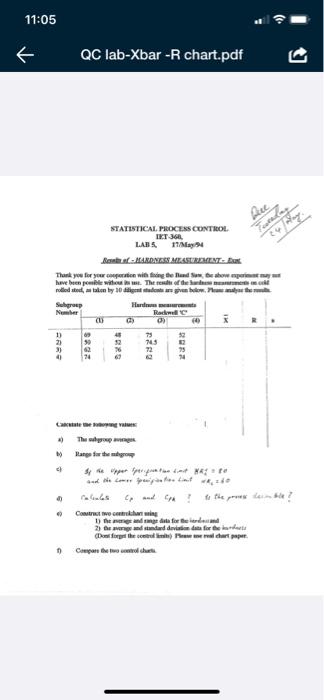
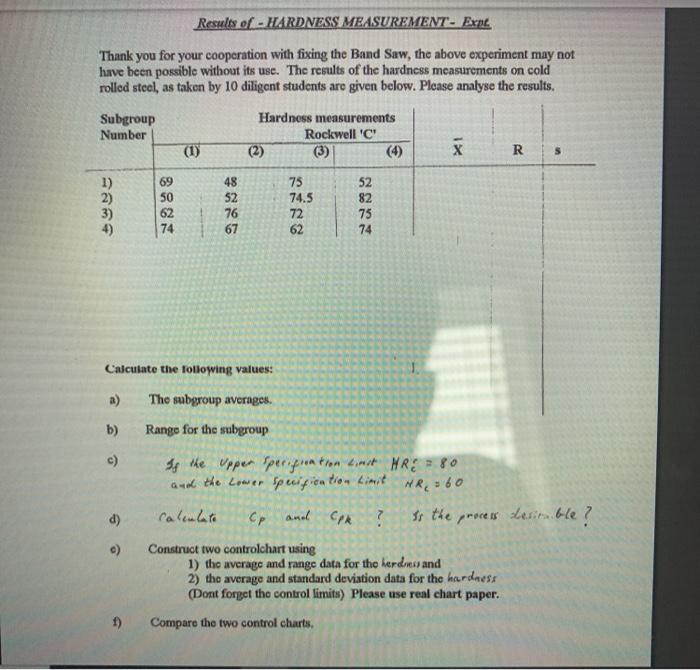
Question: 11:05 { k QC lab-Xbar-R chart.pdf Trading STATISTICAL PROCESS CONTROL IKT-36. LABS 17/May Rom-MADNESS MEASUREMENT have been promile without. The rest of these oded, talon

11:05 { k QC lab-Xbar-R chart.pdf Trading
11:05 { k QC lab-Xbar-R chart.pdf Trading STATISTICAL PROCESS CONTROL IKT-36. LABS 17/May Rom-MADNESS MEASUREMENT have been promile without. The rest of these oded, talon by 10 gangreb. Subgroep Hard Number Rad 0) 23 3) 4 28 12 16 743 24 Carta sy e per per punto de W e poi . Control the concharles 1) henge andre data for the end 2) the standard di don for the ne Delfie the heral chart paper Compare 0 Results of - HARDNESS MEASUREMENT - Expe. Thank you for your cooperation with fixing the Band Saw, the above experiment may not have been possible without its use. The results of the hardness measurements on cold rolled steel, as taken by 10 diligent students are given below. Please analyse the results. Subgroup Number Hardness measurements Rockwell 'C' (2) (1) 1> R S 1) 2) 3) 4) 69 50 62 74 48 52 76 67 75 74.5 72 62 52 82 75 74 Calculate the following values: a) The subgroup averages. b) Range for the subgroup d) c) Is the upper specifuation sint HR = 80 Gul the Lower Specification Limit NR, = 60 cp and CPR ? y the process desible? Construct two controlchart using 1) the average and range data for the herdress and 2) the average and standard deviation data for the hardness (Dont forget the control limits) Please use real chart paper. Compare the two control charts 1)

Step by Step Solution

There are 3 Steps involved in it

1 Expert Approved Answer
Step: 1 Unlock blur-text-image
Question Has Been Solved by an Expert!

Get step-by-step solutions from verified subject matter experts

Step: 2 Unlock
Step: 3 Unlock

Students Have Also Explored These Related General Management Questions!