

Question: . 12. Mr. D wants to investigate if student performance on a final exam is related to time spent studying for the exam. He gathered
.
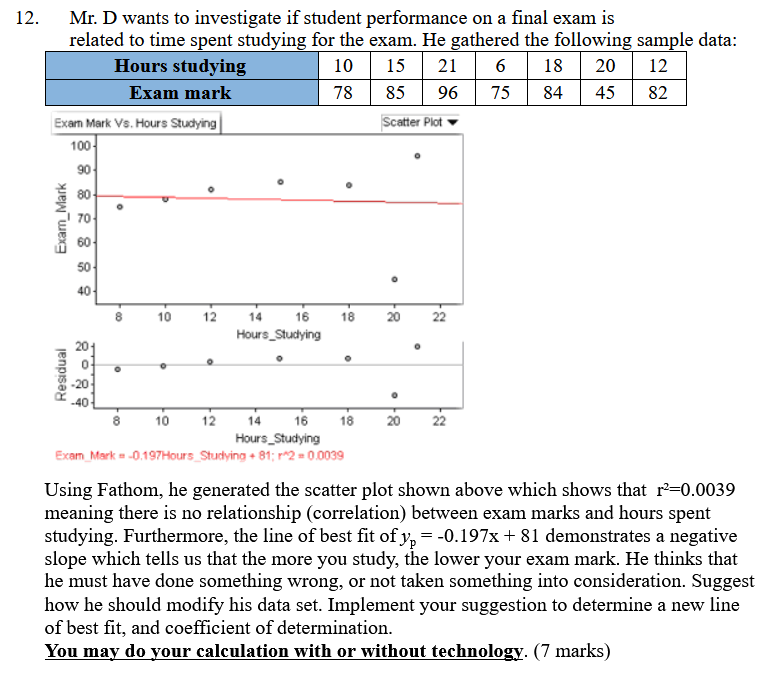
12. Mr. D wants to investigate if student performance on a final exam is related to time spent studying for the exam. He gathered the following sample data: Hours studying 10 15 21 6 18 20 12 Exam mark 78 85 96 75 84 45 82 Exam Mark V's. Hours Studying Scatter Plot 100 90 Exam Mark 8 10 12 14 16 18 20 22 Hours_Studying Residual 10 12 14 16 18 20 22 Hours_Studying Exam_Mark = -0.197Hours_Studying + 81; r^2 = 0.0039 Using Fathom, he generated the scatter plot shown above which shows that r=0.0039 meaning there is no relationship (correlation) between exam marks and hours spent studying. Furthermore, the line of best fit of yo = -0.197x + 81 demonstrates a negative slope which tells us that the more you study, the lower your exam mark. He thinks that he must have done something wrong, or not taken something into consideration. Suggest how he should modify his data set. Implement your suggestion to determine a new line of best fit, and coefficient of determination. You may do your calculation with or without technology. (7 marks)
Step by Step Solution
There are 3 Steps involved in it

Get step-by-step solutions from verified subject matter experts