

Question: 1.summarize and interpret those values, including the Sample Mean, Sample Standard Deviation, Confidence Level, t-value, and the error. 2.Use those values to find the 95%
1.summarize and interpret those values, including the Sample Mean, Sample Standard Deviation, Confidence Level, t-value, and the error.
2.Use those values to find the 95% confidence interval for the mean for your set of data, showingall ofyour work.
3.What does the confidence interval tell you about the data, in the medical context of your data?
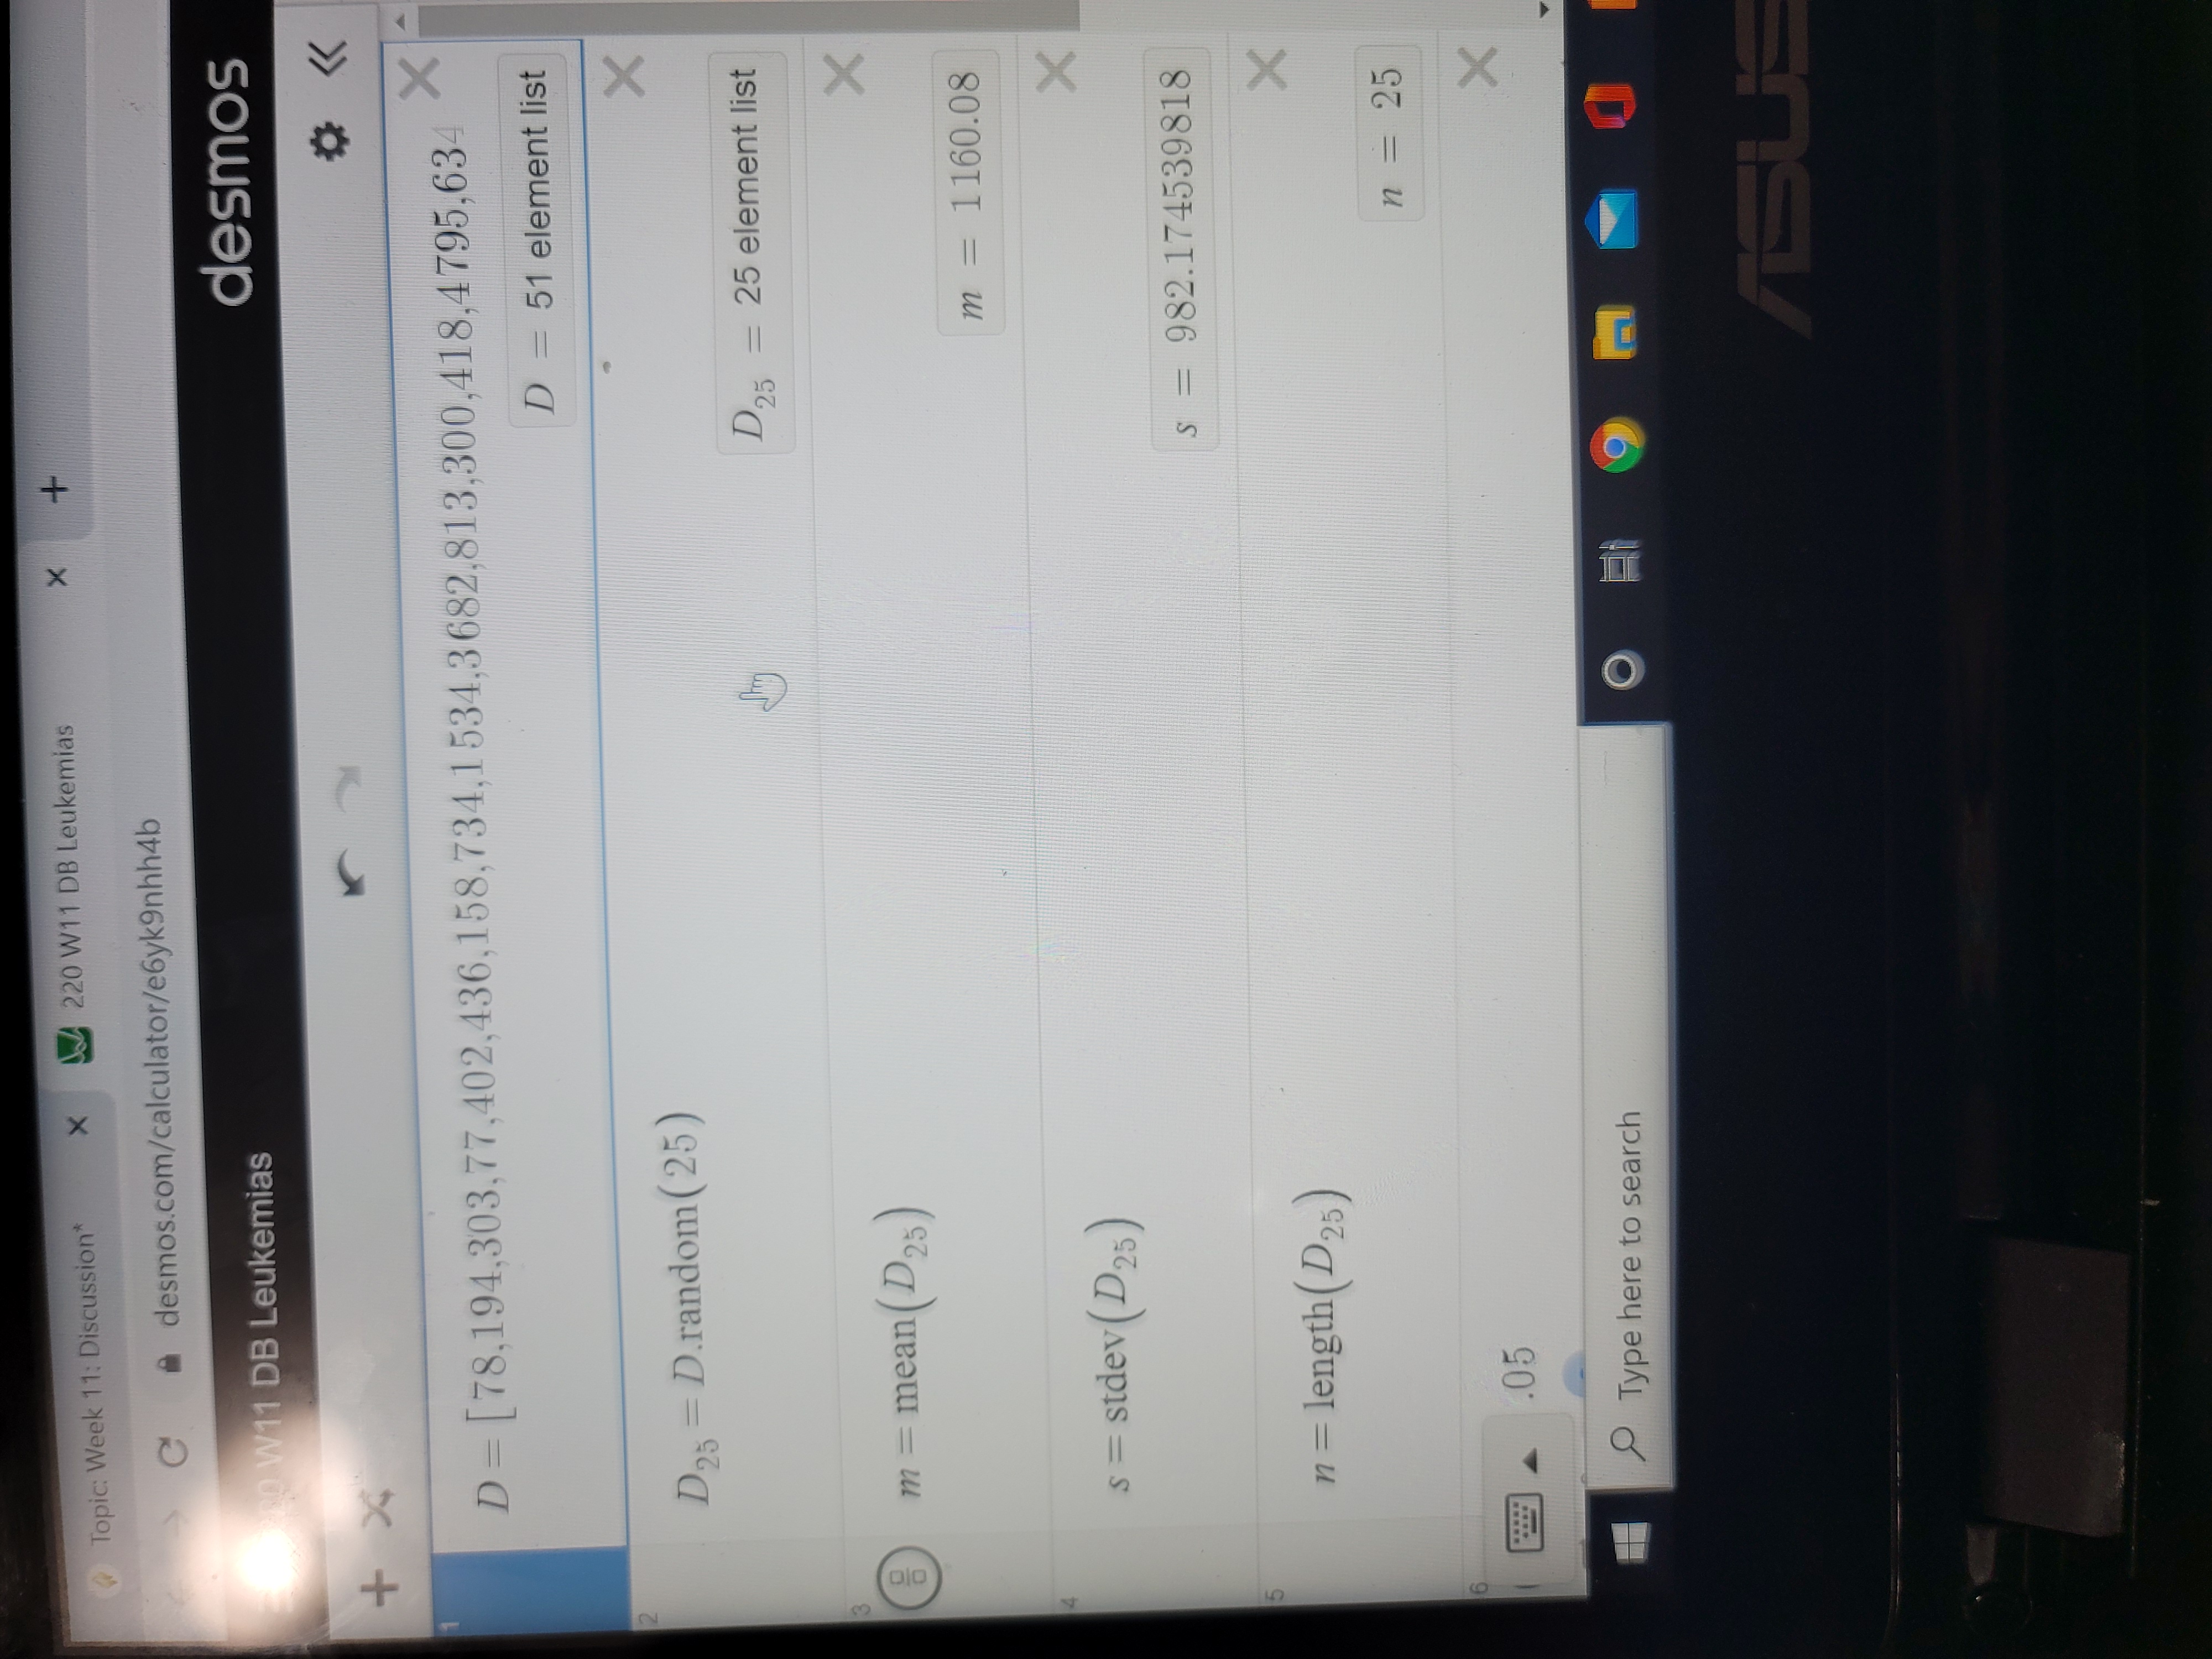
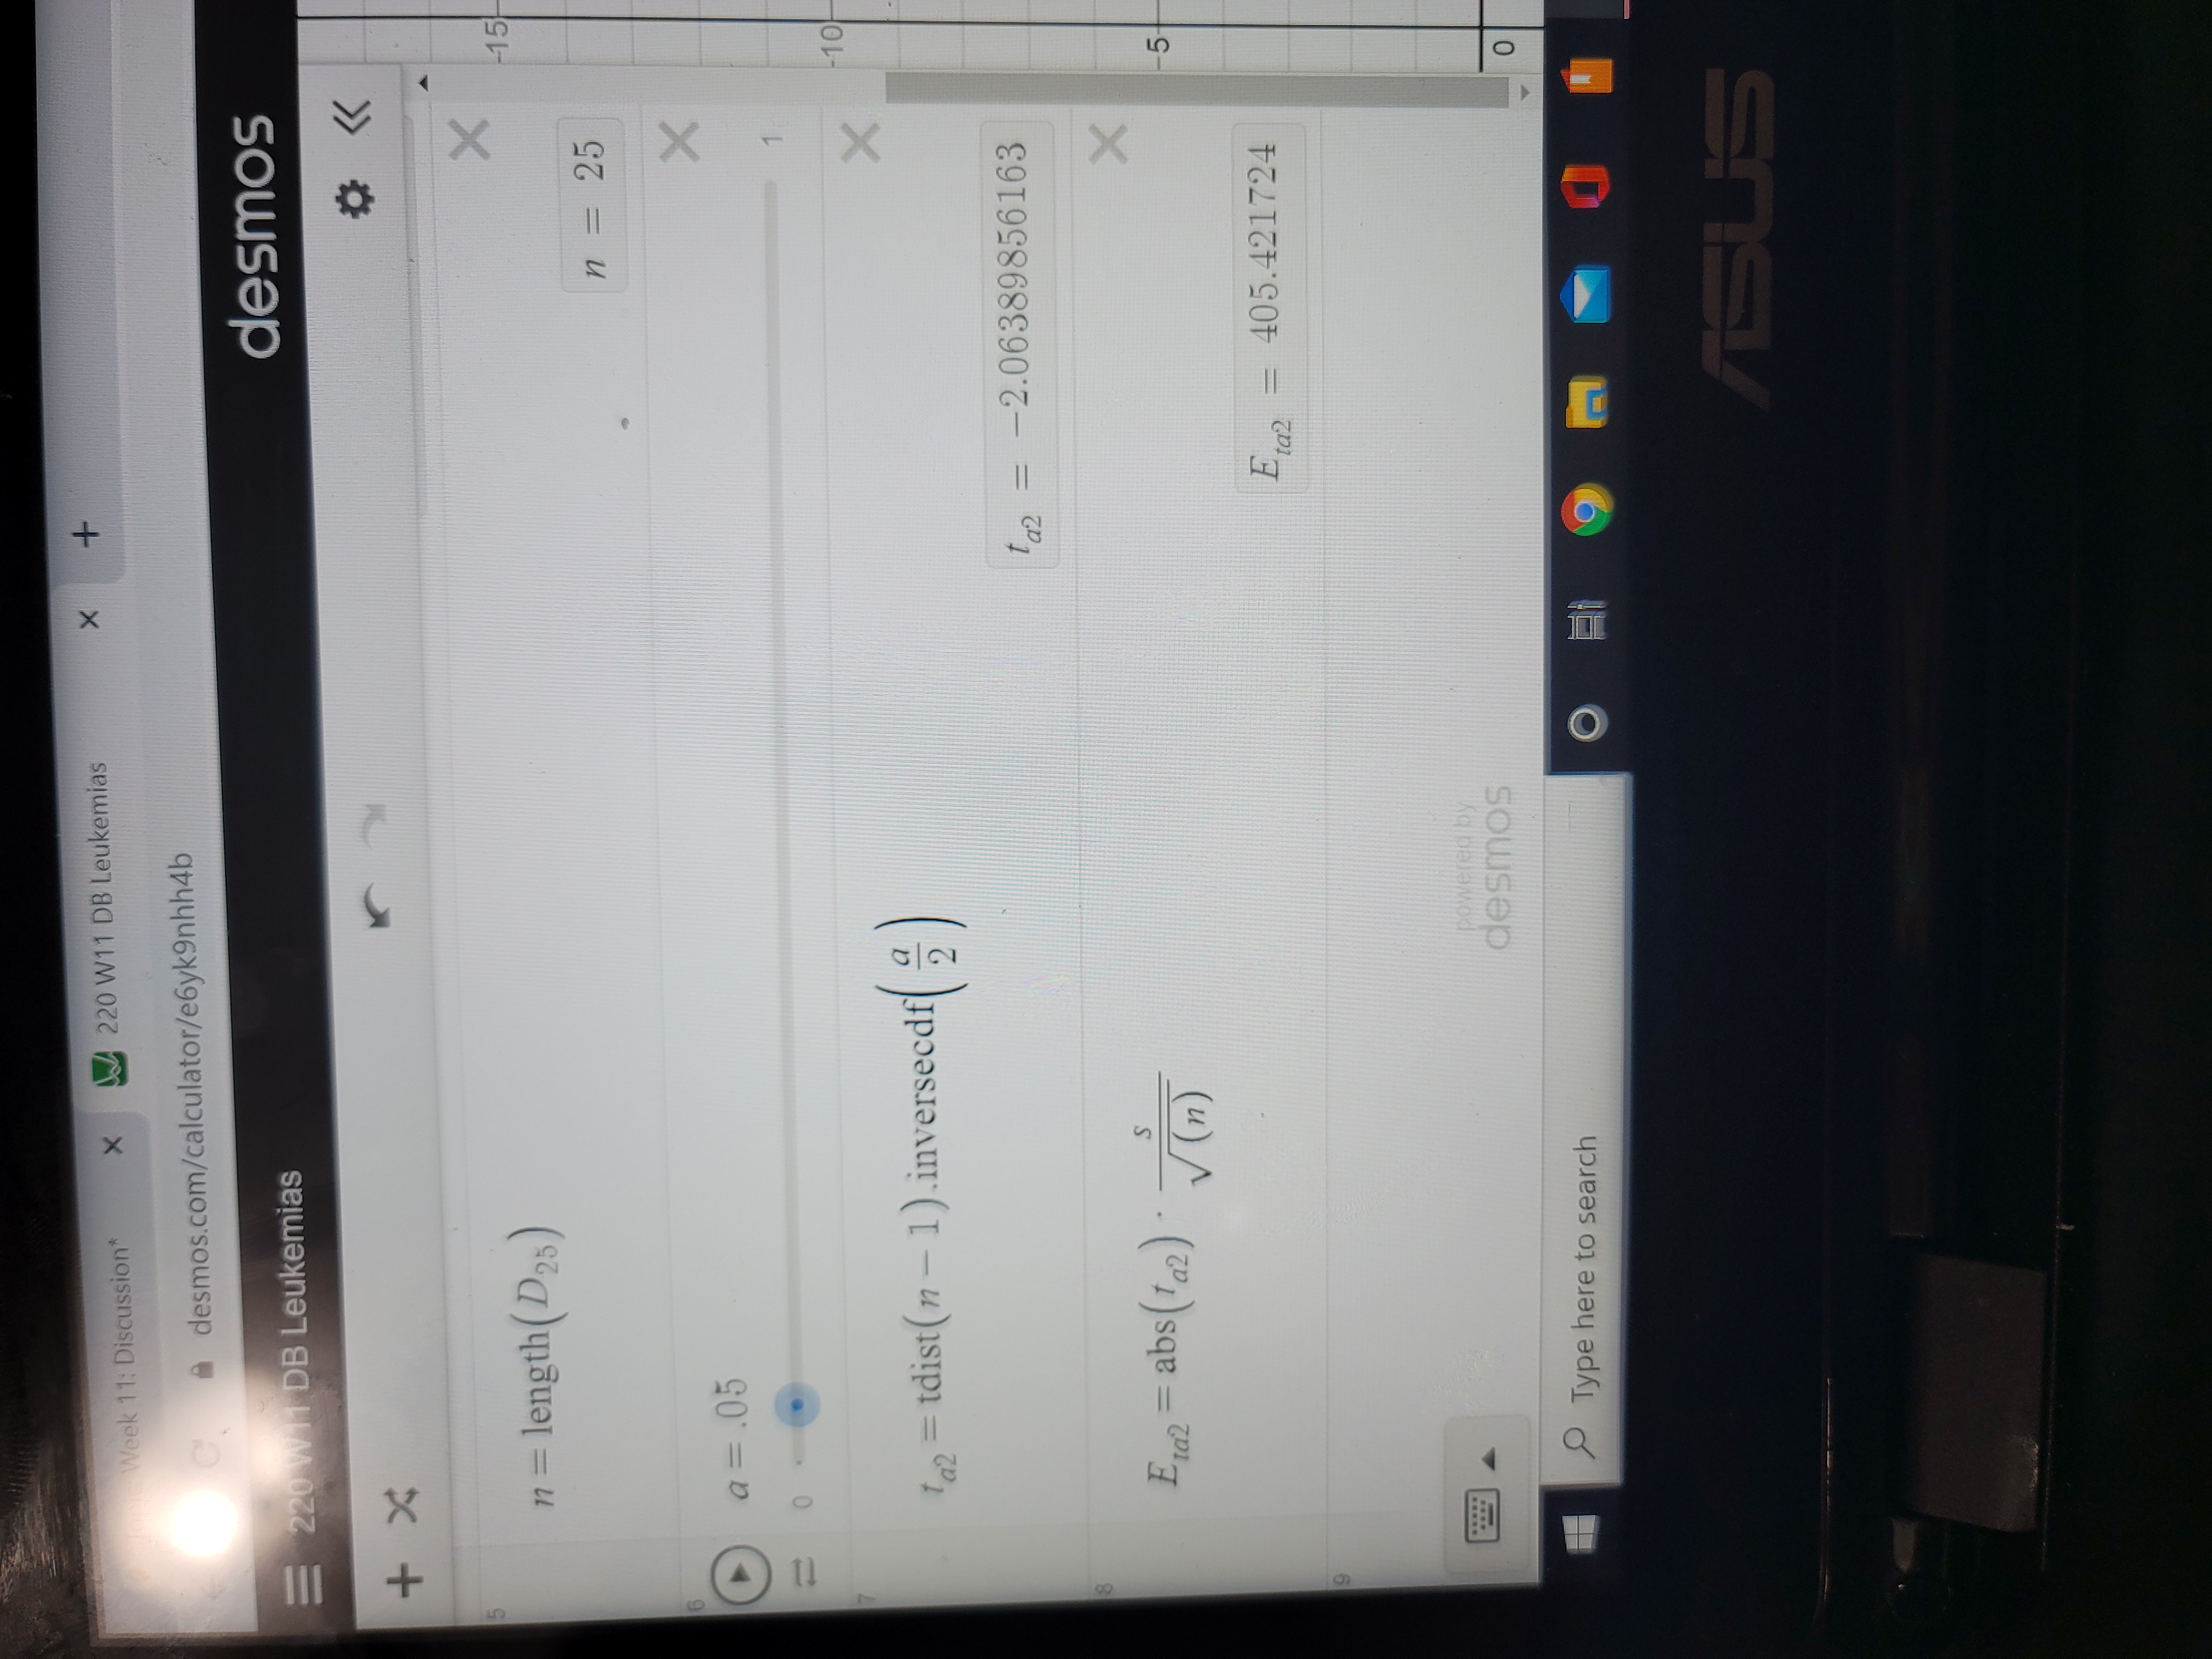
"Topic: Week 11: Discussion* X 220 W11 DB Leukemias X A desmos.com/calculator/eGyk9nhh4b 10 W11 DB Leukemias desmos + D = [78,194,303,77,402,436,158,734,1534,3682,813,300,418,4795,634 X D = 51 element list D23 = D.random (25) X D25 = 25 element list m = mean ( D25) X m = 1160.08 s = stdev (D25) X S = 982.174539818 n = length(D25) X n = 25 6 .05 X Type here to search O 9 SUS\f
Step by Step Solution
There are 3 Steps involved in it

Get step-by-step solutions from verified subject matter experts