

Question: ( 2 0 % ) Table below presents the experimental VLE data for the isopropanol ( 1 ) / benzene ( 2 ) system at
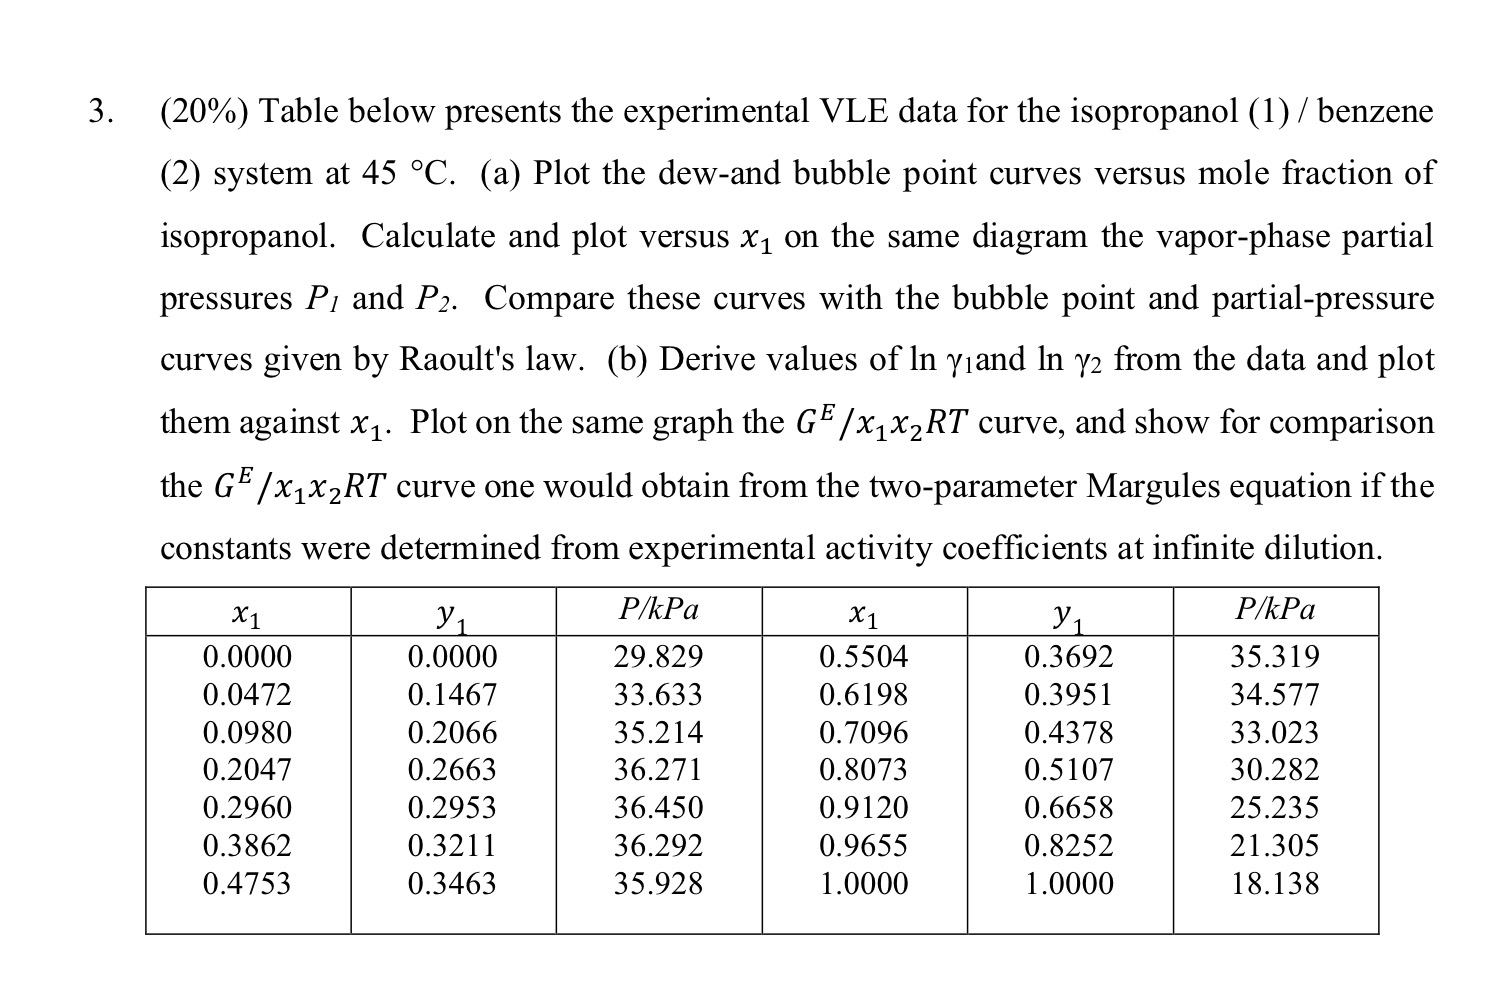
Table below presents the experimental VLE data for the isopropanol benzene system at a Plot the dewand bubble point curves versus mole fraction of isopropanol. Calculate and plot versus on the same diagram the vaporphase partial pressures and Compare these curves with the bubble point and partialpressure curves given by Raoult's law. b Derive values of and from the data and plot them against Plot on the same graph the curve, and show for comparison the curve one would obtain from the twoparameter Margules equation if the constants were determined from experimental activity coefficients at infinite dilution.
table
Step by Step Solution
There are 3 Steps involved in it
1 Expert Approved Answer
Step: 1 Unlock

Question Has Been Solved by an Expert!
Get step-by-step solutions from verified subject matter experts
Step: 2 Unlock
Step: 3 Unlock