

Question: 2 . 1 6 It is general practice in engineering and science that equations be plotted as lines and discrete data as symbols. Here are
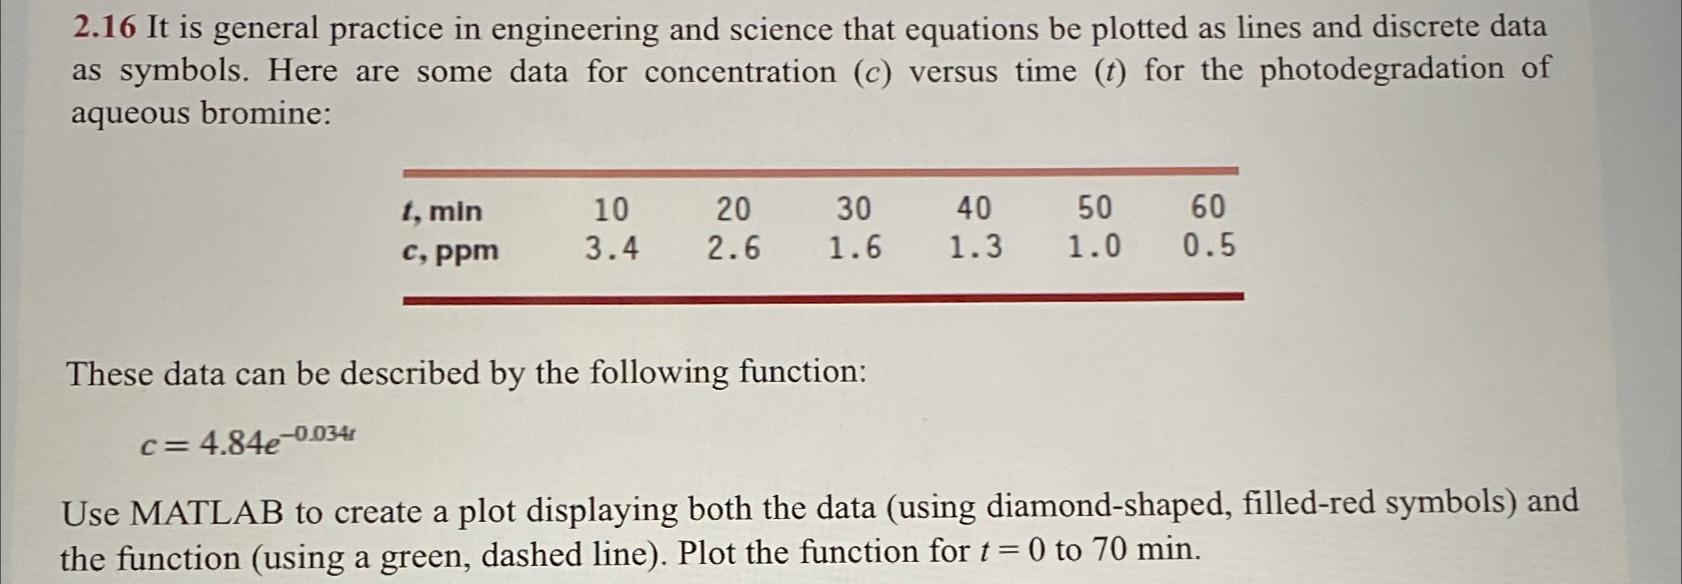
It is general practice in engineering and science that equations be plotted as lines and discrete data as symbols. Here are some data for concentration versus time for the photodegradation of aqueous bromine:
tablemin, ppm
These data can be described by the following function:
Use MATLAB to create a plot displaying both the data using diamondshaped, filledred symbols and the function using a green, dashed line Plot the function for to min.
Step by Step Solution
There are 3 Steps involved in it
1 Expert Approved Answer
Step: 1 Unlock

Question Has Been Solved by an Expert!
Get step-by-step solutions from verified subject matter experts
Step: 2 Unlock
Step: 3 Unlock