

Question: - It is general practice in engineering and science that equations be plotted as lines and discrete data as symbols. Here are some data for
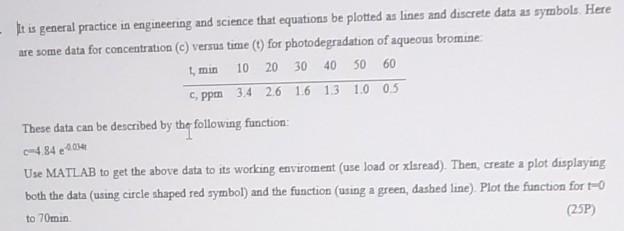
- It is general practice in engineering and science that equations be plotted as lines and discrete data as symbols. Here are some data for concentration (c) versus time (t) for photodegradation of aqueous bromine 10 20 30 40 50 60 C, pprn 34 26 16 13 10 05 These data can be described by the following function: -48405 Use MATLAB to get the above data to its working enviroment (use load or xlsread). Then, create a plot displaying both the data (using circle shaped red symbol) and the function (using a green, dashed line). Plot the function for to (25P) to 70min
Step by Step Solution
There are 3 Steps involved in it
1 Expert Approved Answer
Step: 1 Unlock

Question Has Been Solved by an Expert!
Get step-by-step solutions from verified subject matter experts
Step: 2 Unlock
Step: 3 Unlock