

Question: It is general practice in engineering and science that equations be plotted as lines and discrete data as symbols. Here are some data for concentration
It is general practice in engineering and science that equations be plotted as lines and discrete data as symbols. Here are some data for concentration (c) versus time (t) for the photodegradation of aqueous bromine:
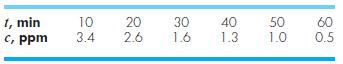
These data can be described by the following function:
c = 4.84e−0.034t
Use MATLAB to create a plot displaying both the data (using diamond-shaped, filled-red symbols) and the function (using a green, dashed line). Plot the function for t = 0 to 70 min.
1, min c, ppm 10 3.4 20 30 2.6 1.6 40 1.3 50 1.0 60 0.5
Step by Step Solution
3.51 Rating (144 Votes )
There are 3 Steps involved in it
To create a plot in MATLAB displaying both the data and the function you can follow these steps Defi... View full answer

Get step-by-step solutions from verified subject matter experts