

Question: 2 A (9) 1L 2B (g) + C (9) The reaction proceeds to equilibrium as shown in the following graphs, however, in Figure 1 more
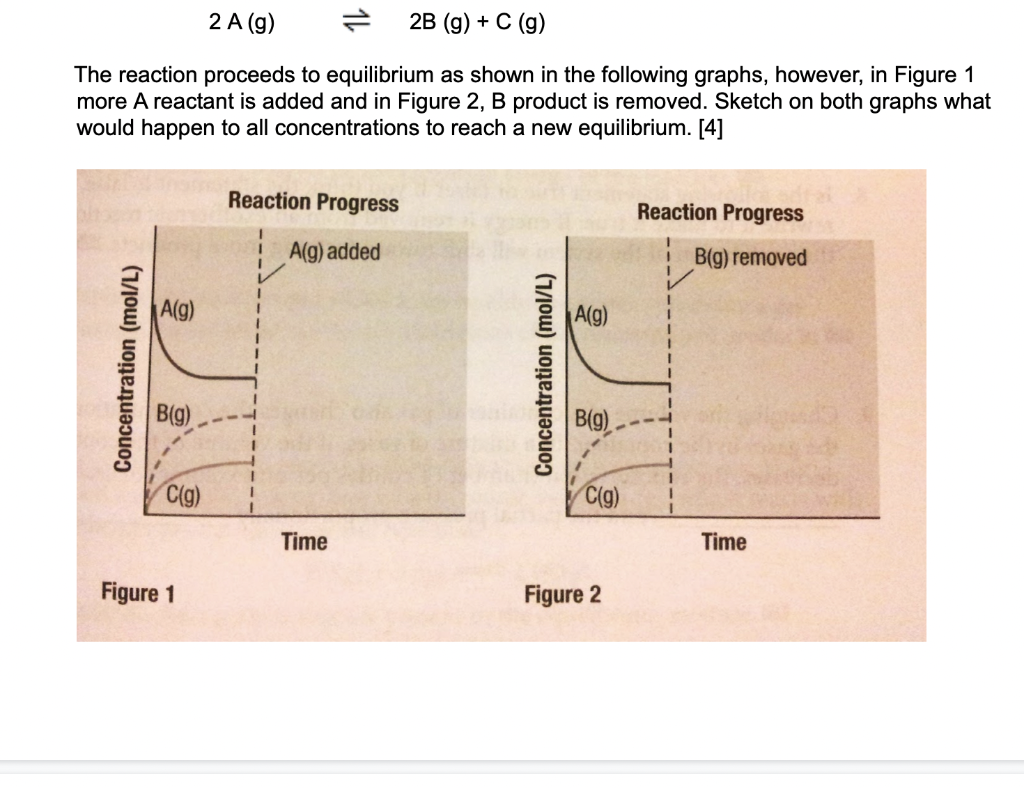
2 A (9) 1L 2B (g) + C (9) The reaction proceeds to equilibrium as shown in the following graphs, however, in Figure 1 more A reactant is added and in Figure 2, B product is removed. Sketch on both graphs what would happen to all concentrations to reach a new equilibrium. [4] Reaction Progress Reaction Progress A(9) added B(g) removed A(g) A(9) Concentration (mol/L) Concentration (mol/L) B(g) B(g) C(g) 1 1 C(9) Time Time Figure 1 Figure 2
Step by Step Solution
There are 3 Steps involved in it
1 Expert Approved Answer
Step: 1 Unlock

Question Has Been Solved by an Expert!
Get step-by-step solutions from verified subject matter experts
Step: 2 Unlock
Step: 3 Unlock