

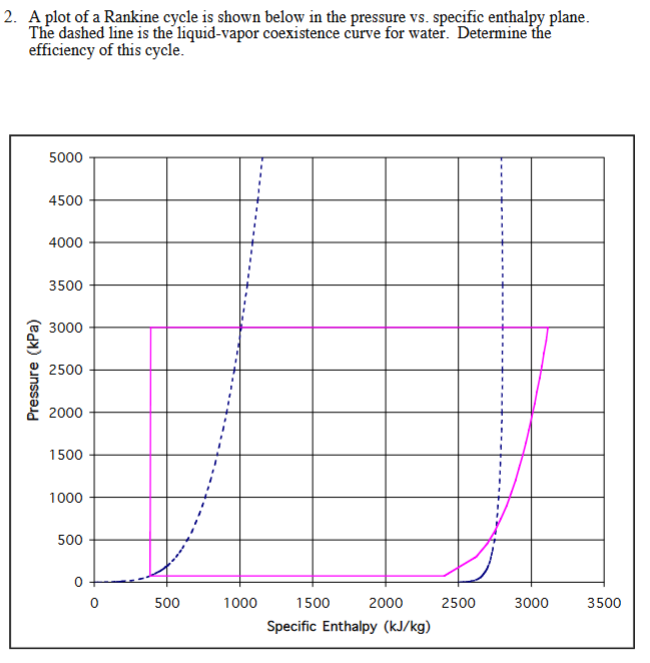
Question: 2 . A plot of a Rankine cycle is shown below in the pressure vs . specific enthalpy plane. The dashed line is the liquid
A plot of a Rankine cycle is shown below in the pressure vs specific enthalpy plane. The dashed line is the liquidvapor coexistence curve for water. Determine the efficiency of this cycle.
Step by Step Solution
There are 3 Steps involved in it
1 Expert Approved Answer
Step: 1 Unlock

Question Has Been Solved by an Expert!
Get step-by-step solutions from verified subject matter experts
Step: 2 Unlock
Step: 3 Unlock