

Question: 2. Autofit column widths. 3. Determine (you must use functions in your formulas): a) Each student's average; apply an appropriate label. b) Class average/subject; apply
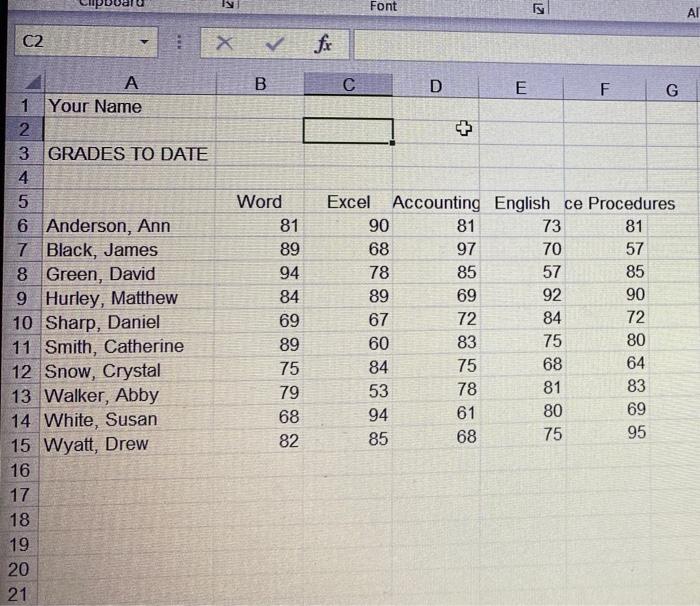
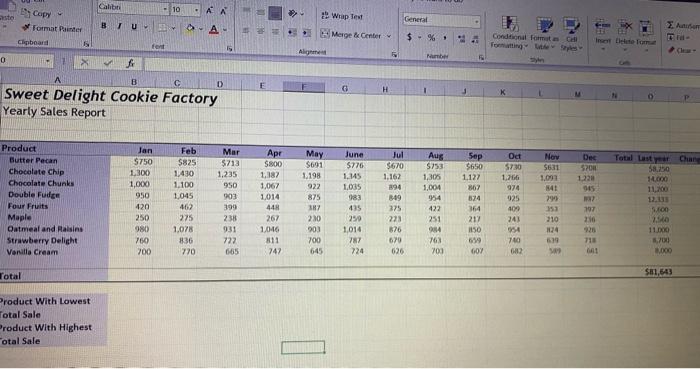
7 Font C2 x B D E F G 1 Your Name 2 3 GRADES TO DATE 4 5 6 Anderson, Ann 7 Black, James 8 Green, David 9 Hurley, Matthew 10 Sharp, Daniel 11 Smith, Catherine 12 Snow, Crystal 13 Walker, Abby 14 White, Susan 15 Wyatt, Drew 16 17 18 Word 81 89 94 84 69 89 75 79 68 82 Excel Accounting English ce Procedures 90 81 73 81 68 97 70 57 78 85 57 85 89 69 92 90 67 84 72 60 83 75 80 84 75 68 53 78 81 83 94 61 69 85 68 75 95 72 64 80 19 20 21 Calibri 10 . 2 Wrap Test General BTU A ty Copy sto Format Painter Ginboard 0 ..Merge & Center $ - %. Conditional form fent 5 sy f D G H Sweet Delight Cookie Factory Yearly Sales Report Mar May $691 Od Now Dec Aug 5753 1,305 5200 1,198 1220 Product Butter Pecan Chocolate Chip Chocolate Chunks Double Fudge Four Fruits Maple Oatmeal and Raisins Strawberry Delight Vanilla Cream 1.004 Jan $750 1,300 1,000 950 420 250 980 760 200 Feb $825 1/430 1.100 1.045 462 275 1,078 836 770 Apr $800 1,187 1,067 1,014 448 267 1,046 11 747 $713 1,235 950 903 399 238 931 722 665 Total Last Chane $8.50 14.00 11,00 12.11 June 5776 1.145 1,035 983 435 250 1,014 787 724 922 875 187 210 903 700 645 Jul $670 1.162 894 3-09 375 223 676 670 626 Sep $650 1.127 867 624 364 217 150 954 422 251 984 763 700 5730 1,266 974 925 405 241 954 740 62 $631 1,091 141 295 13 210 1124 69 297 216 926 713 2.0 11.00 3.00 GOY 1000 Total $81,643 Product With Lowest Total Sale Product With Highest otal Sale - 7 Font C2 x B D E F G 1 Your Name 2 3 GRADES TO DATE 4 5 6 Anderson, Ann 7 Black, James 8 Green, David 9 Hurley, Matthew 10 Sharp, Daniel 11 Smith, Catherine 12 Snow, Crystal 13 Walker, Abby 14 White, Susan 15 Wyatt, Drew 16 17 18 Word 81 89 94 84 69 89 75 79 68 82 Excel Accounting English ce Procedures 90 81 73 81 68 97 70 57 78 85 57 85 89 69 92 90 67 84 72 60 83 75 80 84 75 68 53 78 81 83 94 61 69 85 68 75 95 72 64 80 19 20 21 Calibri 10 . 2 Wrap Test General BTU A ty Copy sto Format Painter Ginboard 0 ..Merge & Center $ - %. Conditional form fent 5 sy f D G H Sweet Delight Cookie Factory Yearly Sales Report Mar May $691 Od Now Dec Aug 5753 1,305 5200 1,198 1220 Product Butter Pecan Chocolate Chip Chocolate Chunks Double Fudge Four Fruits Maple Oatmeal and Raisins Strawberry Delight Vanilla Cream 1.004 Jan $750 1,300 1,000 950 420 250 980 760 200 Feb $825 1/430 1.100 1.045 462 275 1,078 836 770 Apr $800 1,187 1,067 1,014 448 267 1,046 11 747 $713 1,235 950 903 399 238 931 722 665 Total Last Chane $8.50 14.00 11,00 12.11 June 5776 1.145 1,035 983 435 250 1,014 787 724 922 875 187 210 903 700 645 Jul $670 1.162 894 3-09 375 223 676 670 626 Sep $650 1.127 867 624 364 217 150 954 422 251 984 763 700 5730 1,266 974 925 405 241 954 740 62 $631 1,091 141 295 13 210 1124 69 297 216 926 713 2.0 11.00 3.00 GOY 1000 Total $81,643 Product With Lowest Total Sale Product With Highest otal Sale
Step by Step Solution
There are 3 Steps involved in it

Get step-by-step solutions from verified subject matter experts