

Question: 2. By using the data in the sample table in Appendix A, Plot the calibration curve of Concentration of NaCI (M) vs Conductivity. Determine the
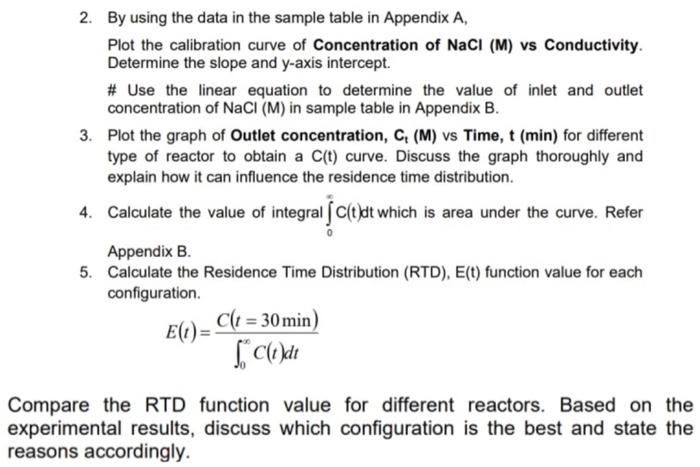
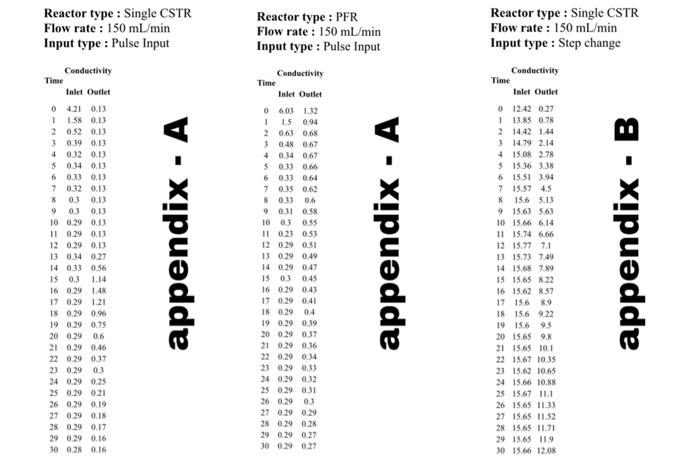
2. By using the data in the sample table in Appendix A, Plot the calibration curve of Concentration of NaCI (M) vs Conductivity. Determine the slope and y-axis intercept. # Use the linear equation to determine the value of inlet and outlet concentration of NaCI (M) in sample table in Appendix B. 3. Plot the graph of Outlet concentration, C. (M) vs Time, t (min) for different type of reactor to obtain a C(t) curve. Discuss the graph thoroughly and explain how it can influence the residence time distribution 4. Calculate the value of integral (C(t)dt which is area under the curve. Refer Appendix B. 5. Calculate the Residence Time Distribution (RTD), E(t) function value for each configuration t $*Cli)dt E(t) = C(1 = 30 min) Compare the RTD function value for different reactors. Based on the experimental results, discuss which configuration is the best and state the reasons accordingly. Reactor type: Single CSTR Flow rate : 150 mL/min Input type : Pulse Input Reactor type : PFR Flow rate : 150 mL/ min Input type : Pulse Input Reactor type: Single CSTR Flow rate : 150 mL/min Input type : Step change A 1 Conductivity Time Inlet Outlet 04.21 0.13 1158 0.13 20.52 0.13 3 0.39 0.13 4 0.32 0.13 5 0.34 0.13 6 0.33 0.13 7 0.32 0.13 8 03 0.13 0.3 0.13 10 0.29 0.13 11 0.29 0.1 12 0.29 0.13 130.34 0.27 14 0.33 0.56 15 03 16 0.29 14 17 0.29 1.21 18 0.29 0.96 19 0.29 0.75 20 0.29 0.6 21 0.29 0.46 22 0.29 0.37 23 0.29 0.3 24 0.29 0.25 25 0.29 0.21 26 0.29 0.19 27 0.29 0.18 28 0.29 0.17 29 0.29 0.16 30 0.28 0.16 appendix Conductivity Time Inlet Outlet 06:03 1.32 1 1.5 0.94 2 0.61 0.6% 30,48 0,67 4 0.34 0.67 5033 0.66 6 0.33 064 7 0.15 0.62 8013 06 9 031 0.58 10 03 OSS 11 0.23 0.53 12 0.29 0.51 130.29 0.49 14 0.29 0.47 1903 0.45 16 0.29 0.43 17 0.29 0.41 1% 0.29 04 19 0.29 0.39 20 0.29 0.37 21 0.29 0.36 22 0.20 0.14 23 0.29 0.33 24 0.29 0.32 25 0.29 0.31 26 0.29 0.3 27 0.29 0.29 28 0.29 0.2% 29 0.29 0.27 30 0.29 0.27 appendix Conductivity Time Inlet Outlet 0 12.42 0.27 1 13.85 0.78 2 14.42 1.44 3 14.79 2.14 4 15.08 2.78 5 15:16 3:38 6 15.51 3.94 7 15.57 4.5 * 15.6 5.13 9 15.63 5.63 10 15.66 6.14 11 15.74 6.66 12 15.77 7.1 13 15.73 7.49 14 15.68 7.89 15 15.65 822 16 15.62 8.57 17 156 89 18 15.6 9.22 19 156 95 20 15.6598 21 15.65 10.1 22 15.67 10.35 23 15.62 10.65 24 15.66 10.88 25 15.67 11.1 26 15.65 11.33 27 15.65 11.52 28 15.65 11.71 29 15.65 119 30 15.66 12.08 appendix 2. By using the data in the sample table in Appendix A, Plot the calibration curve of Concentration of NaCI (M) vs Conductivity. Determine the slope and y-axis intercept. # Use the linear equation to determine the value of inlet and outlet concentration of NaCI (M) in sample table in Appendix B. 3. Plot the graph of Outlet concentration, C. (M) vs Time, t (min) for different type of reactor to obtain a C(t) curve. Discuss the graph thoroughly and explain how it can influence the residence time distribution 4. Calculate the value of integral (C(t)dt which is area under the curve. Refer Appendix B. 5. Calculate the Residence Time Distribution (RTD), E(t) function value for each configuration t $*Cli)dt E(t) = C(1 = 30 min) Compare the RTD function value for different reactors. Based on the experimental results, discuss which configuration is the best and state the reasons accordingly. Reactor type: Single CSTR Flow rate : 150 mL/min Input type : Pulse Input Reactor type : PFR Flow rate : 150 mL/ min Input type : Pulse Input Reactor type: Single CSTR Flow rate : 150 mL/min Input type : Step change A 1 Conductivity Time Inlet Outlet 04.21 0.13 1158 0.13 20.52 0.13 3 0.39 0.13 4 0.32 0.13 5 0.34 0.13 6 0.33 0.13 7 0.32 0.13 8 03 0.13 0.3 0.13 10 0.29 0.13 11 0.29 0.1 12 0.29 0.13 130.34 0.27 14 0.33 0.56 15 03 16 0.29 14 17 0.29 1.21 18 0.29 0.96 19 0.29 0.75 20 0.29 0.6 21 0.29 0.46 22 0.29 0.37 23 0.29 0.3 24 0.29 0.25 25 0.29 0.21 26 0.29 0.19 27 0.29 0.18 28 0.29 0.17 29 0.29 0.16 30 0.28 0.16 appendix Conductivity Time Inlet Outlet 06:03 1.32 1 1.5 0.94 2 0.61 0.6% 30,48 0,67 4 0.34 0.67 5033 0.66 6 0.33 064 7 0.15 0.62 8013 06 9 031 0.58 10 03 OSS 11 0.23 0.53 12 0.29 0.51 130.29 0.49 14 0.29 0.47 1903 0.45 16 0.29 0.43 17 0.29 0.41 1% 0.29 04 19 0.29 0.39 20 0.29 0.37 21 0.29 0.36 22 0.20 0.14 23 0.29 0.33 24 0.29 0.32 25 0.29 0.31 26 0.29 0.3 27 0.29 0.29 28 0.29 0.2% 29 0.29 0.27 30 0.29 0.27 appendix Conductivity Time Inlet Outlet 0 12.42 0.27 1 13.85 0.78 2 14.42 1.44 3 14.79 2.14 4 15.08 2.78 5 15:16 3:38 6 15.51 3.94 7 15.57 4.5 * 15.6 5.13 9 15.63 5.63 10 15.66 6.14 11 15.74 6.66 12 15.77 7.1 13 15.73 7.49 14 15.68 7.89 15 15.65 822 16 15.62 8.57 17 156 89 18 15.6 9.22 19 156 95 20 15.6598 21 15.65 10.1 22 15.67 10.35 23 15.62 10.65 24 15.66 10.88 25 15.67 11.1 26 15.65 11.33 27 15.65 11.52 28 15.65 11.71 29 15.65 119 30 15.66 12.08 appendix
Step by Step Solution
There are 3 Steps involved in it

Get step-by-step solutions from verified subject matter experts