

Question: 2. Consider a log-linear regression for the weekly sales (number of cans) of a national brand of canned tuna (SALI - target brand sales)
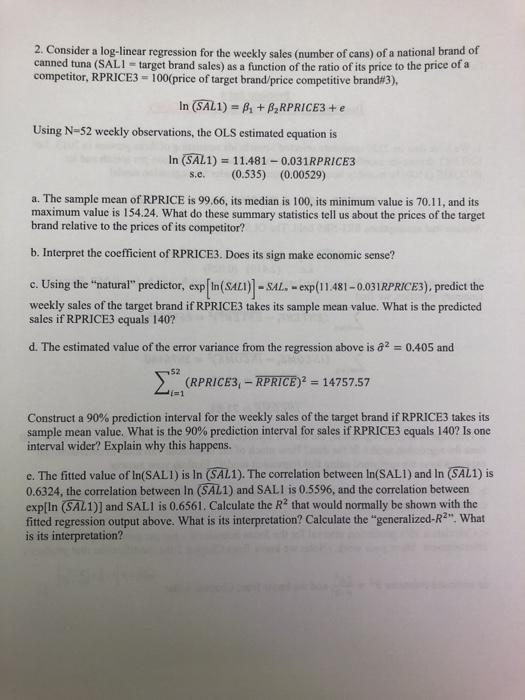
2. Consider a log-linear regression for the weekly sales (number of cans) of a national brand of canned tuna (SALI - target brand sales) as a function of the ratio of its price to the price of a competitor, RPRICE3-100(price of target brand/price competitive brand#3), In (SAL1)=B + BRPRICE3 + e Using N-52 weekly observations, the OLS estimated equation is In (SAL1) 11.481 -0.031RPRICE3 S.C. (0.535) (0.00529) = a. The sample mean of RPRICE is 99.66, its median is 100, its minimum value is 70.11, and its maximum value is 154.24. What do these summary statistics tell us about the prices of the target brand relative to the prices of its competitor? b. Interpret the coefficient of RPRICE3. Does its sign make economic sense? c. Using the "natural" predictor, exp[in (SALT)]-SAL. - exp(11.481-0.031RPRICE3), predict the weekly sales of the target brand if RPRICE3 takes its sample mean value. What is the predicted sales if RPRICE3 equals 140? d. The estimated value of the error variance from the regression above is a = 0.405 and (RPRICE3,- RPRICE) = 14757.57 Construct a 90% prediction interval for the weekly sales of the target brand if RPRICE3 takes its sample mean value. What is the 90% prediction interval for sales if RPRICE3 equals 140? Is one interval wider? Explain why this happens. (=1 e. The fitted value of In(SAL1) is In (SAL1). The correlation between In(SAL1) and In (SAL1) is 0.6324, the correlation between In (SAL1) and SALI is 0.5596, and the correlation between exp[ln (SAL1)] and SAL1 is 0.6561. Calculate the R that would normally be shown with the fitted regression output above. What is its interpretation? Calculate the "generalized-R". What is its interpretation?
Step by Step Solution
3.37 Rating (169 Votes )
There are 3 Steps involved in it
a The summary statistics of RPRICE provide information about the prices of the target brand relative to its competitor The sample mean of RPRICE 9966 indicates that on average the price of the target ... View full answer

Get step-by-step solutions from verified subject matter experts