

Question: Problem 7-7 The results of SPT tests performed with an automatic trip hammer using the standard ASTM split spoon sampler with a liner are
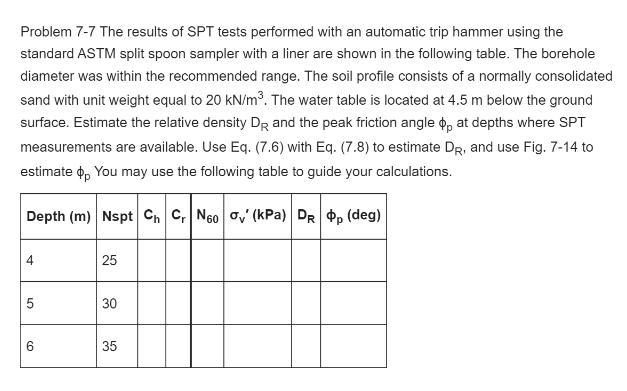
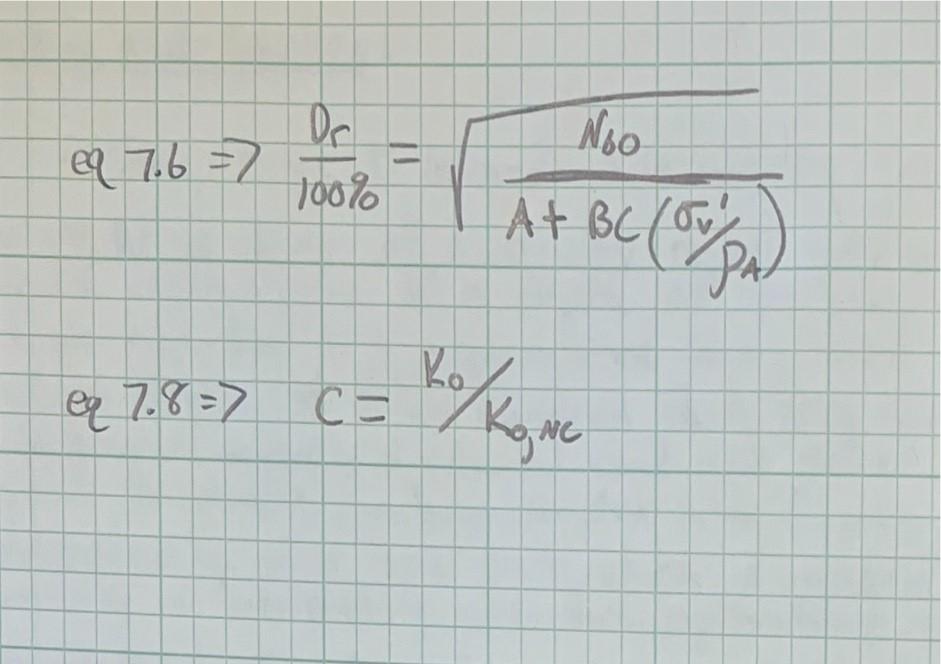
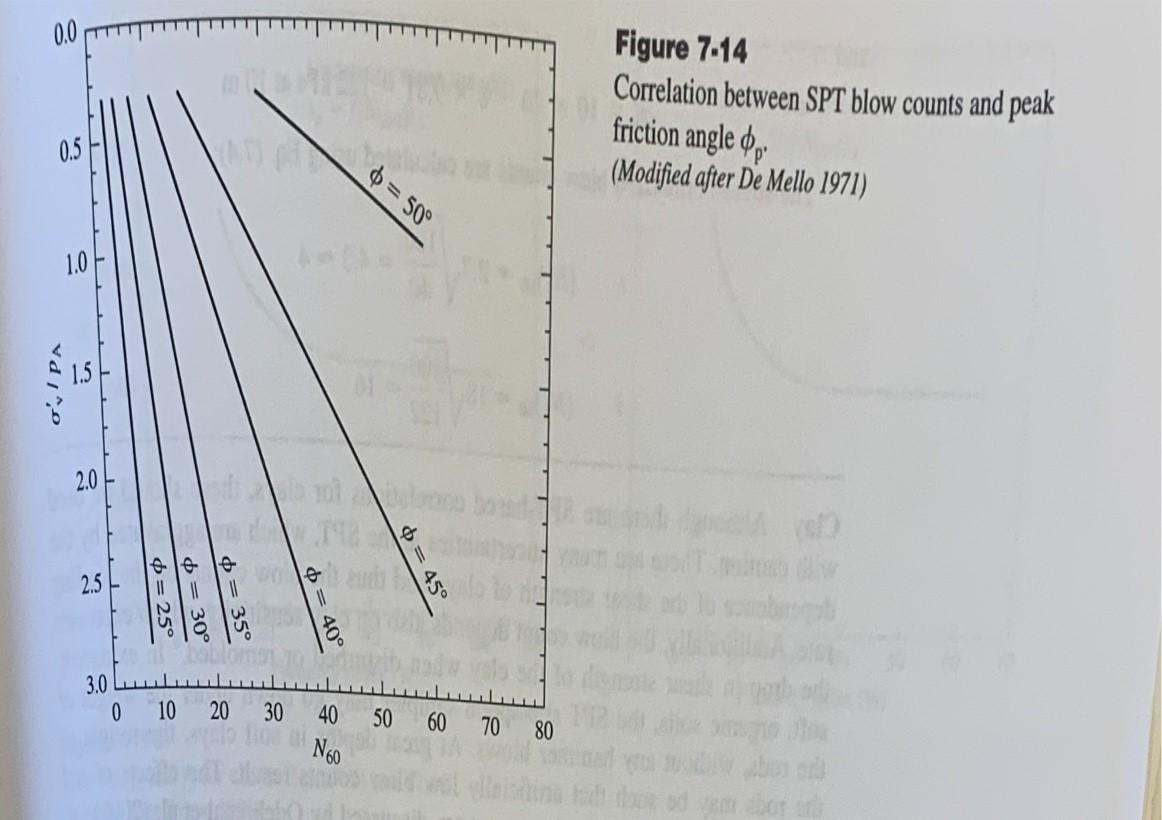
Problem 7-7 The results of SPT tests performed with an automatic trip hammer using the standard ASTM split spoon sampler with a liner are shown in the following table. The borehole diameter was within the recommended range. The soil profile consists of a normally consolidated sand with unit weight equal to 20 kN/m. The water table is located at 4.5 m below the ground surface. Estimate the relative density DR and the peak friction angle, at depths where SPT measurements are available. Use Eq. (7.6) with Eq. (7.8) to estimate DR, and use Fig. 7-14 to estimate , You may use the following table to guide your calculations. Depth (m) Nspt Ch Cr N60 av (kPa) DR op (deg) st 4 5 6 25 30 35 =2 De 100% 7.8=7 C- CH Noo At BC/Ov Ko PAL 0.5 1.0 o'y I PA 5 2.0 2.5 3.0 0 eee = 25 6=30 = 35 10 20 30 $ = 40 40 N60 = 50 = 45 50 60 70 80 Figure 7-14 Correlation between SPT blow counts and peak friction angle 'p' (Modified after De Mello 1971) diw bu sib isting tadi thus od vem abor
Step by Step Solution
3.41 Rating (160 Votes )
There are 3 Steps involved in it
To solve the problem in the image we can use the following steps Calculate the relative density DR at each depth where SPT measurements are available Calculate the peak friction angle phip at each dep... View full answer

Get step-by-step solutions from verified subject matter experts