

Question: ! 2 Given below are annual data for total assets for Johnson & Johnson and UnitedHealth Group for the period 2010-2020, as of December 31st
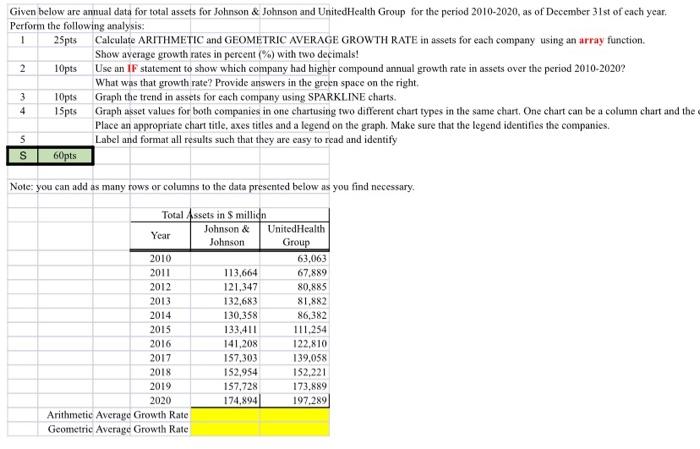
! 2 Given below are annual data for total assets for Johnson & Johnson and UnitedHealth Group for the period 2010-2020, as of December 31st of each year, Perform the following analysis: 25pts Calculate ARITHMETIC and GEOMETRIC AVERAGE GROWTH RATE in assets for each company using an array function. Show average growth rates in percent (%) with two decimals! 10pts Use an IF statement to show which company had higher compound annual growth rate in assets over the period 2010-2020? What was that growth rate? Provide answers in the green space on the right 3 10pts Graph the trend in assets for each company using SPARKLINE charts. 15pts Graph asset values for both companies in one chartusing two different chart types in the same chart. One chart can be a column chart and the Place an appropriate chart title, axes titles and a legend on the graph. Make sure that the legend identifies the companies. Label and format all results such that they are easy to read and identify 60pts 4 5 S 2012 Note: you can add as many rows or columns to the data presented below as you find necessary Total Assets in S million Johnson & United Health Year Johnson Group 2010 63,063 2011 113,664 67,889 121,347 80.885 2013 132,683 81.882 2014 130,358 86,382 2015 133,411 111.254 2016 141,208 122,810 2017 157,303 139,058 2018 152,954 152,221 2019 157,728 173.889 2020 174,894 197.289 Arithmetic Average Growth Rate Geometric Average Growth Rate
Step by Step Solution
There are 3 Steps involved in it

Get step-by-step solutions from verified subject matter experts