

Question: 2) Plot the freezing point data. ( 8 pts) Plot each data set on a separate graph: pure t-butanol on one graph and t-butanol mixture
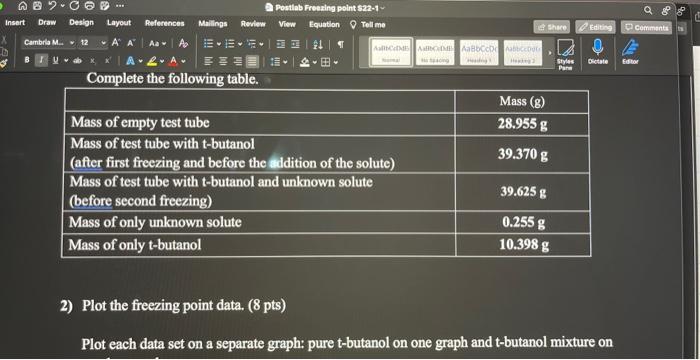
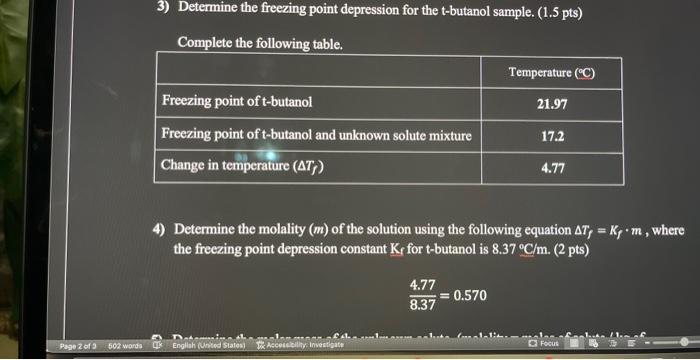
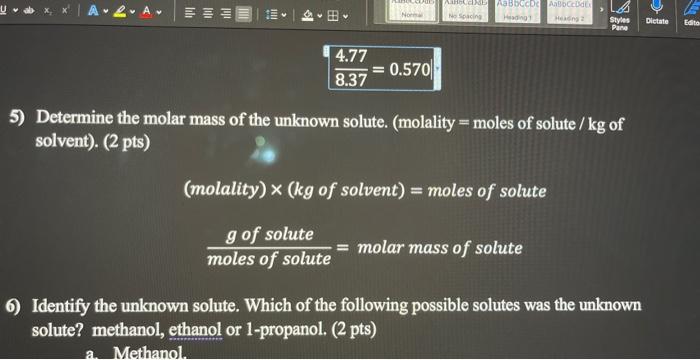
2) Plot the freezing point data. ( 8 pts) Plot each data set on a separate graph: pure t-butanol on one graph and t-butanol mixture on 4) Determine the molality (m) of the solution using the following equation Tf=Kfm, where the freezing point depression constant Kf for t-butanol is 8.37C/m. (2 pts) 8.374.77=0.570 8.374.77=0.570 5) Determine the molar mass of the unknown solute. (molality = moles of solute /kg of solvent). (2 pts) (molality)(kgofsolvent)=molesofsolutemolesofsolutegofsolute=molarmassofsolute Identify the unknown solute. Which of the following possible solutes was the unknown solute? methanol, ethanol or 1-propanol. (2 pts)
Step by Step Solution
There are 3 Steps involved in it
1 Expert Approved Answer
Step: 1 Unlock

Question Has Been Solved by an Expert!
Get step-by-step solutions from verified subject matter experts
Step: 2 Unlock
Step: 3 Unlock