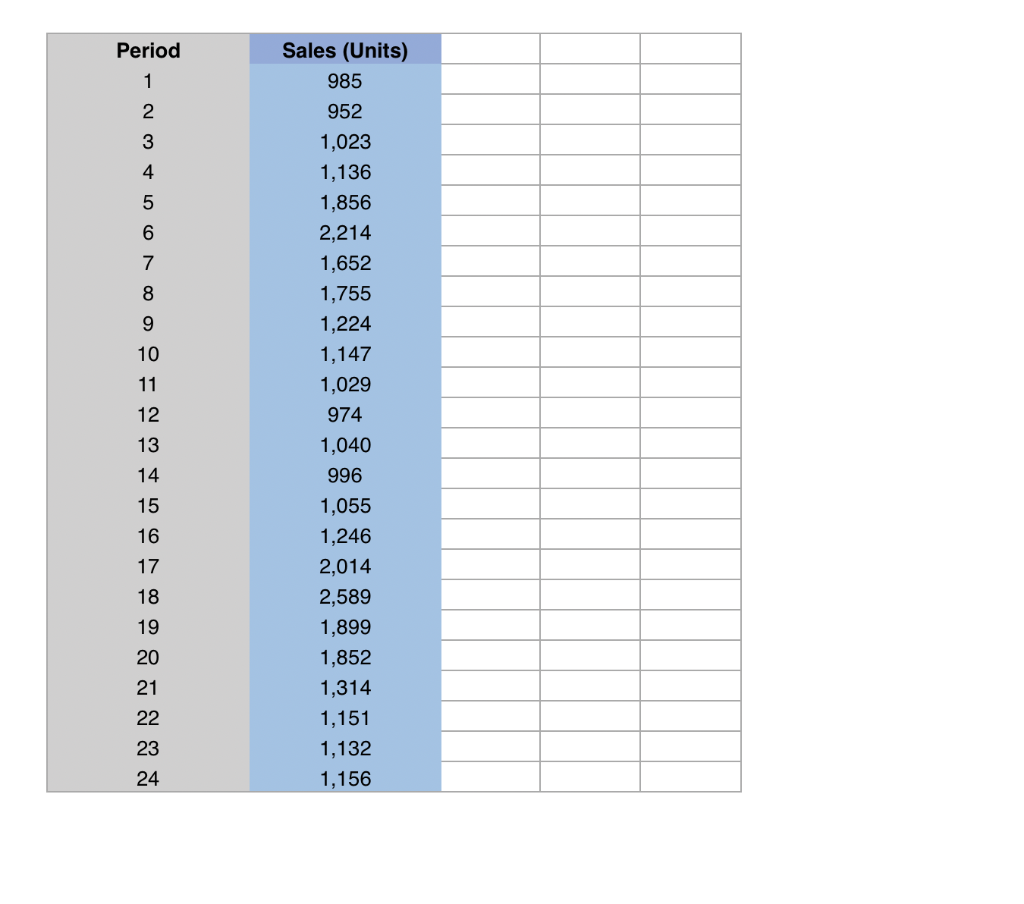
Question: 20 points. Use the data in Excel for this problem (same data used in problem #2). Construct a linear trend forecast. Develop the forecast for

20 points. Use the data in Excel for this problem20 points. Use the data in Excel for this problem

20 points. Use the data in Excel for this problem (same data used in problem #2). Construct a linear trend forecast. Develop the forecast for periods 1-25. Calculate the errors as well as MAD and MAPE. Then, based on these metrics, state whether exponential smoothing or linear trend provides a more accurate forecast. Finally, discuss if any other forecasting technique (one not used) is likely to be more accurate than the exponential smoothing and linear trend forecasts. Period 1 2 3 I 600 V AWN- 5 6 7 12 Sales (Units) 985 952 1,023 1,136 1,856 2,214 1,652 1,755 1,224 1,147 1,029 974 1,040 996 1,055 1,246 2,014 2,589 1,899 1,852 1,314 1,151 1,132 1,156 13 14 15 16 17 18 19 20 21 22 23 24

Step by Step Solution

There are 3 Steps involved in it

1 Expert Approved Answer
Step: 1 Unlock blur-text-image
Question Has Been Solved by an Expert!

Get step-by-step solutions from verified subject matter experts

Step: 2 Unlock
Step: 3 Unlock

Students Have Also Explored These Related General Management Questions!