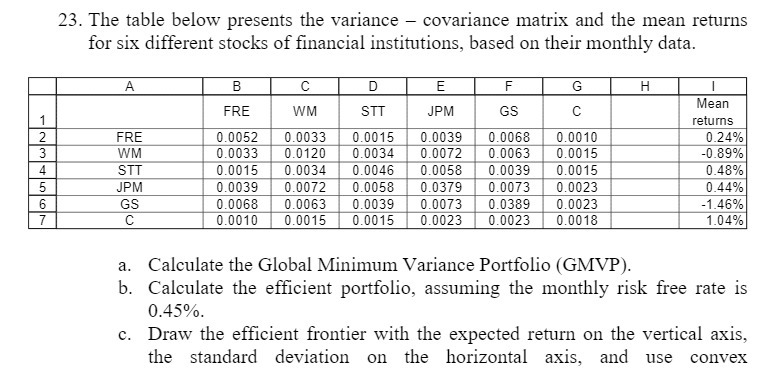
Question: 23. The table below presents the variance - covariance matrix and the mean returns for six different stocks of financial institutions, based on their monthly

23. The table below presents the variance -
23. The table below presents the variance - covariance matrix and the mean returns for six different stocks of financial institutions, based on their monthly data. A B C D E F G H FRE WM STT JPM Mean GS C returns FRE 0.0052 0.0033 0.0015 0.0039 0.0068 0.0010 0.24% WM 0.0033 0.0120 0.0034 0.0072 0.0063 0.0015 -0.89% STT 0.0015 0.0034 0.0046 0.0058 0.0039 0.0015 0.48% JPM 0.0039 0.0072 0.0058 0.0379 0.0073 0.0023 0.44% GS 0.0068 0.0063 0.0039 0.0073 0.0389 0.0023 -1.46% C 0.0010 0.0015 0.0015 0.0023 0.0023 0.0018 1.04% a. Calculate the Global Minimum Variance Portfolio (GMVP). b. Calculate the efficient portfolio, assuming the monthly risk free rate is 0.45%. c. Draw the efficient frontier with the expected return on the vertical axis, the standard deviation on the horizontal axis, and use convex

Step by Step Solution

There are 3 Steps involved in it

1 Expert Approved Answer
Step: 1 Unlock blur-text-image
Question Has Been Solved by an Expert!

Get step-by-step solutions from verified subject matter experts

Step: 2 Unlock
Step: 3 Unlock

Students Have Also Explored These Related Finance Questions!