

Question: 25b) Graph 2 below illustrates a rm that produces and sells widgets. Use the graph to answer the questions given below. (6 marks) o i.
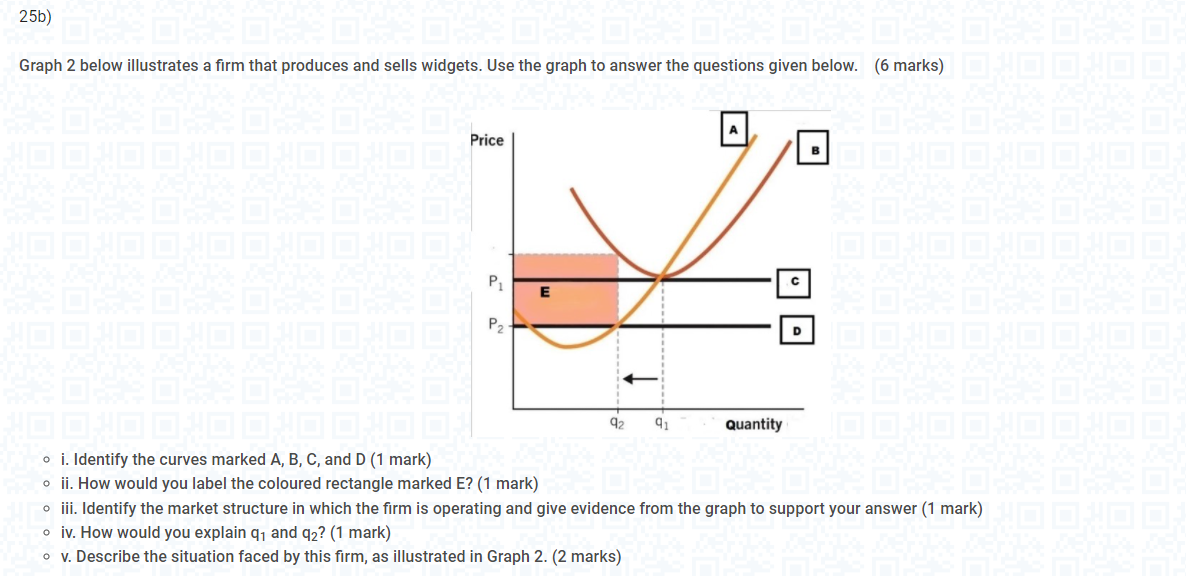
25b) Graph 2 below illustrates a rm that produces and sells widgets. Use the graph to answer the questions given below. (6 marks) o i. Identify the curves marked A, B, C, and D (1 mark) 0 ii. How would you label the coloured rectangle marked E? (1 mark) 0 iii. Identify the market structure in which the rm is operating and give evidence from the graph to support your answer (1 mark) 0 iv. How would you explain q1 and g? (1 mark) 0 v. Describe the situation faced by this rm. as illustrated in Graph 2. (2 marks)
Step by Step Solution
There are 3 Steps involved in it
1 Expert Approved Answer
Step: 1 Unlock

Question Has Been Solved by an Expert!
Get step-by-step solutions from verified subject matter experts
Step: 2 Unlock
Step: 3 Unlock