

Question: 2.9 State three differences between the assembly chart and the operation process chart. 2.13 Consider a simple three-step manufacturing process as illustrated in the given
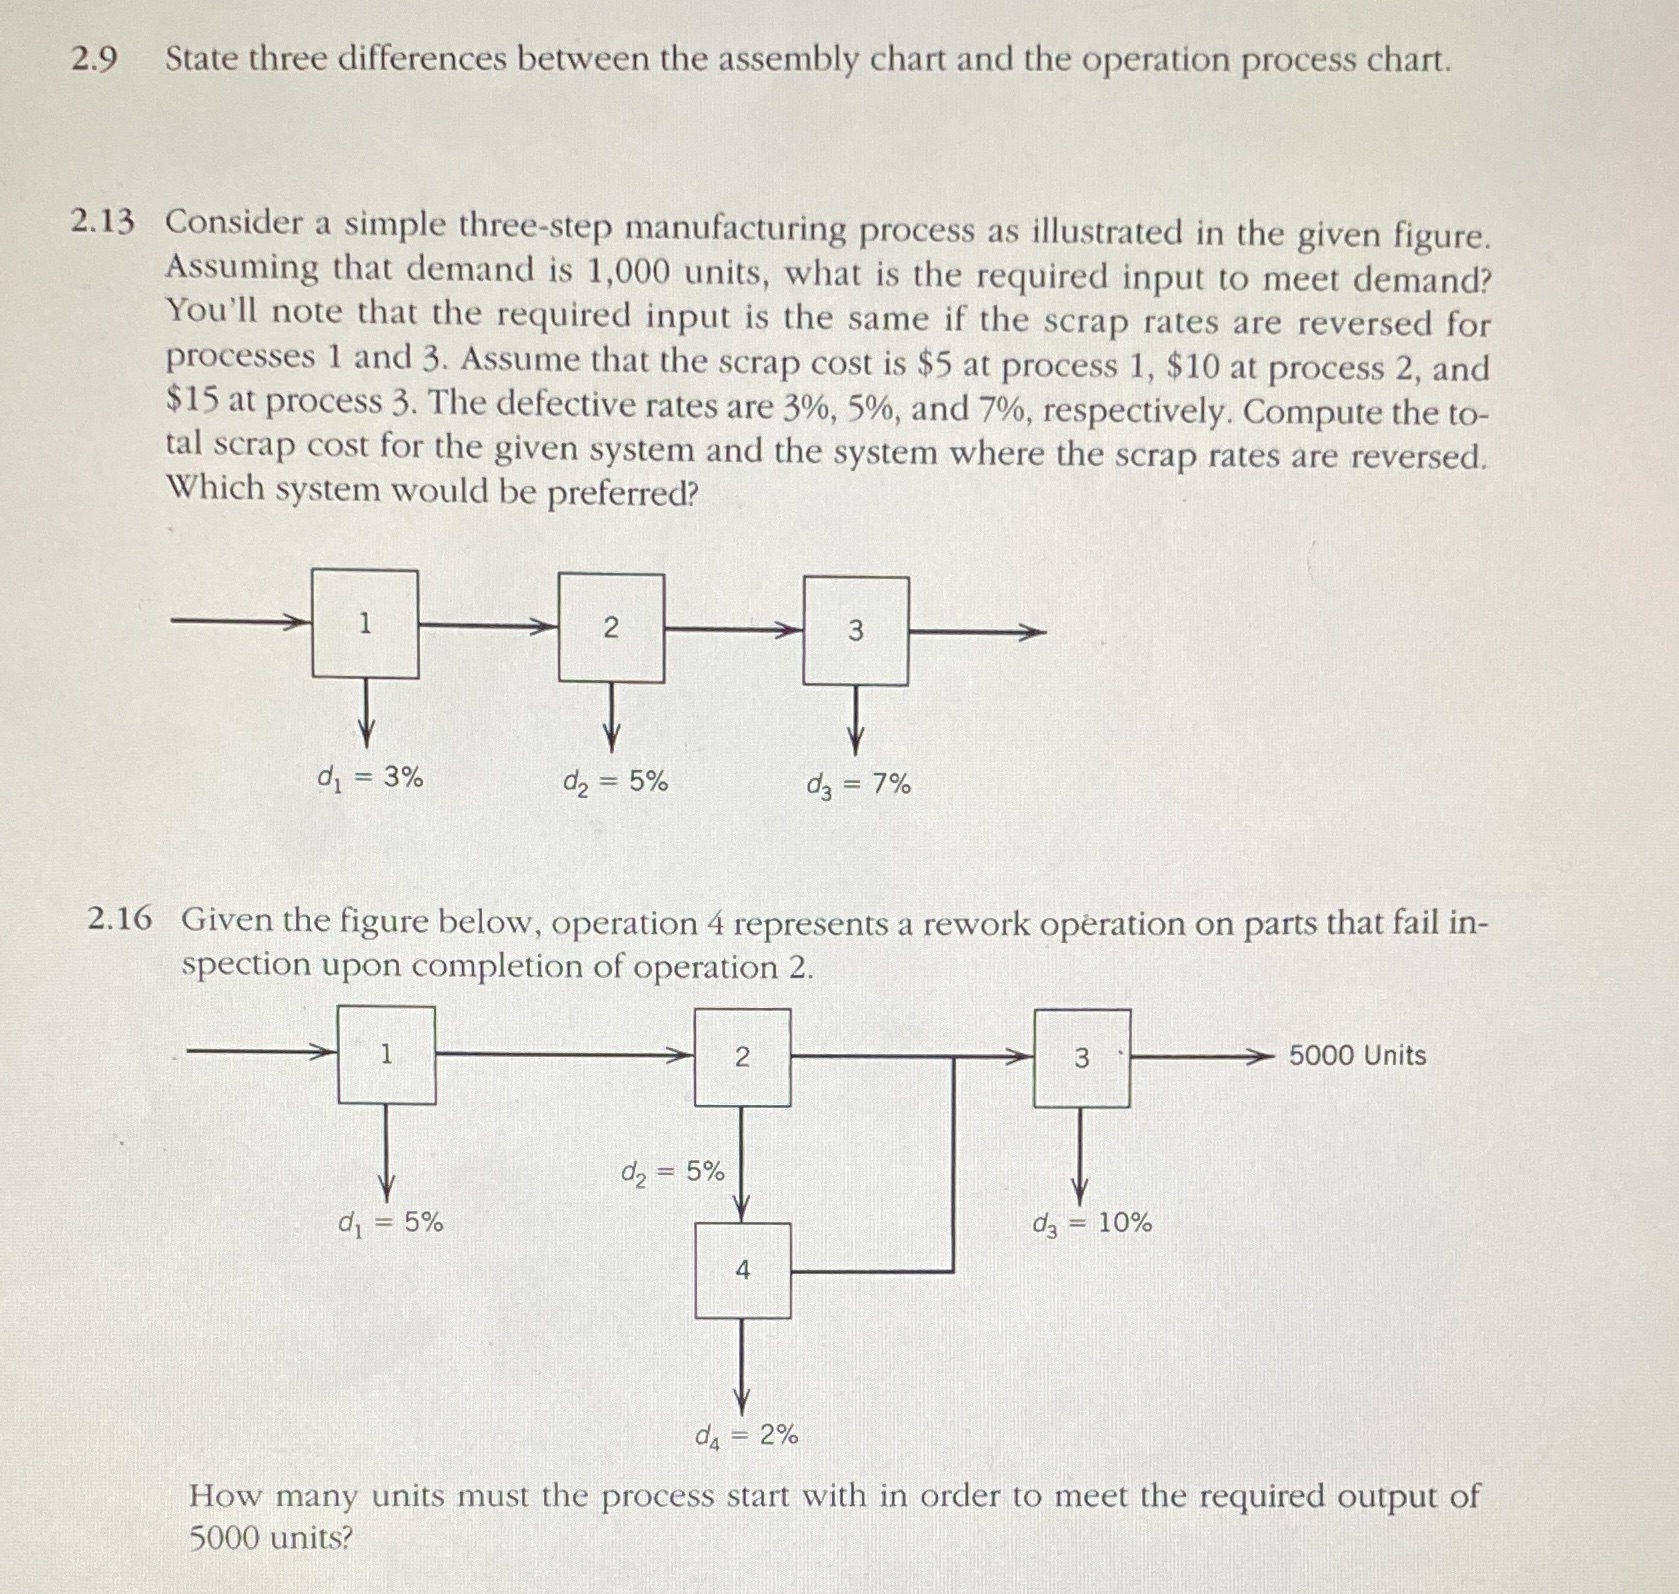
2.9 State three differences between the assembly chart and the operation process chart. 2.13 Consider a simple three-step manufacturing process as illustrated in the given figure. Assuming that demand is 1,000 units, what is the required input to meet demand? You'll note that the required input is the same if the scrap rates are reversed for processes 1 and 3. Assume that the scrap cost is $5 at process 1, $10 at process 2, and $15 at process 3. The defective rates are 3%, 5%, and 7%, respectively. Compute the to- tal scrap cost for the given system and the system where the scrap rates are reversed. Which system would be preferred? 1 = 3% d2 = 5% d3 = 7% 2.16 Given the figure below, operation 4 represents a rework operation on parts that fail in- spection upon completion of operation 2. 2 3 5000 Units 2 = 5% 1 = 5% 3 = 10% 4 d4 = 2% How many units must the process start with in order to meet the required output of 5000 units
Step by Step Solution
There are 3 Steps involved in it

Get step-by-step solutions from verified subject matter experts