

Question: 2D. Based on your NPV Scenario / Risk Analysis Grids, is NPV more sensitive to changing cost of capital or changing salvage values? How do
2D. Based on your NPV Scenario / Risk Analysis Grids, is NPV more sensitive to changing cost of capital or changing salvage values? How do you determine this?
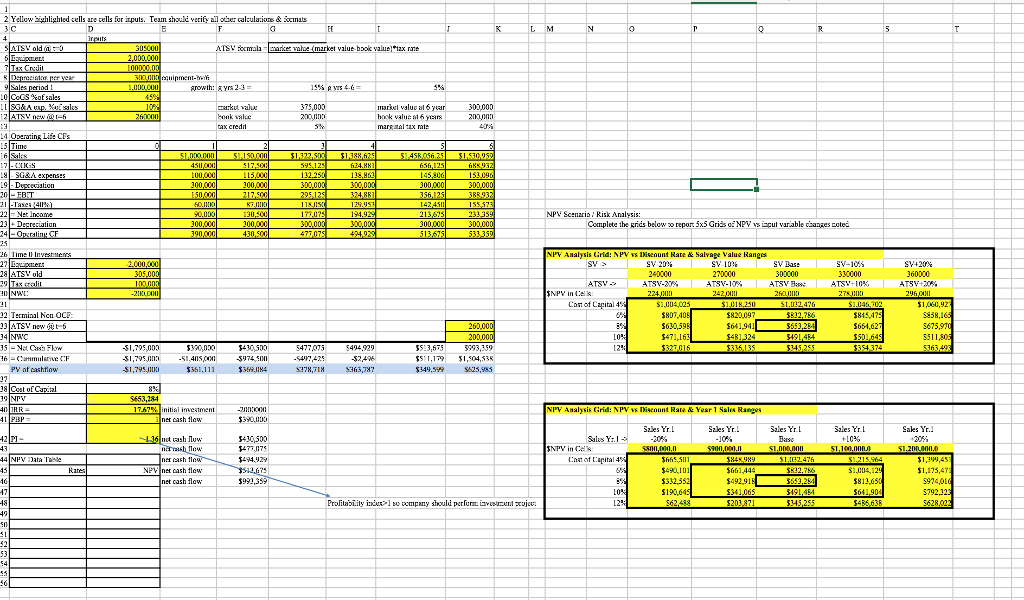
2E. Based on your NPV Scenario / Risk Analysis Grids, is NPV more sensitive to changing cost of capital or changing year one sales level assumptions? How do you determine this?
2 Yellow ghlighled cells are cells for izputs. Team should verify ail oier clulio & ATSV Bocmal emzrket valuboo aleizx rare 375,003 market value al 6yar NPY Scenaria /Risk Analysis: 00,000 Complete the grids below o report 5x5 Gris cENPV s icut arable canges NPV Analysis Grid: NPV iseount Rate& Salvaee Value Rangrs SV 20% SV 10% SV Dase SV-105. SV+20% ATSV ATSV-37% ATSV-10% ATSV Bs ATSV-10% ATSV , 20% Cost of Capital 4 1004,005 $807,40 S63059 S471,16 $1,000,92 5858,16 675,9 $845,47 S651,62 2 Terminal Ncn OCF S641941 26000 00.00 393,359 30000 51.415,00 $361.111 43500 574 0 49429 52.49 78,1363,787 513,575 $51.1$1,504,538 $349,59 $25,98 51,9-51 54742 5653,184 67initial imetment NPV Analysis Grid: NPV v Disenunt Rat&Yexr 1 Sales Ranges net cash tlow ales Yr. Bales Yrl Base Bales Yrl aks Yr. 306 Sales Yr 430,500 Salus Y.l 1036 NPV in Cas 149492 3512 $992,3 $1,394 hi5,l11 $490,101 PV net cash flow net cash flow $661,444 $49291 $1,175,47 924,0 5792,12 S1.004, 10 $812,6 $190,64 2 Yellow ghlighled cells are cells for izputs. Team should verify ail oier clulio & ATSV Bocmal emzrket valuboo aleizx rare 375,003 market value al 6yar NPY Scenaria /Risk Analysis: 00,000 Complete the grids below o report 5x5 Gris cENPV s icut arable canges NPV Analysis Grid: NPV iseount Rate& Salvaee Value Rangrs SV 20% SV 10% SV Dase SV-105. SV+20% ATSV ATSV-37% ATSV-10% ATSV Bs ATSV-10% ATSV , 20% Cost of Capital 4 1004,005 $807,40 S63059 S471,16 $1,000,92 5858,16 675,9 $845,47 S651,62 2 Terminal Ncn OCF S641941 26000 00.00 393,359 30000 51.415,00 $361.111 43500 574 0 49429 52.49 78,1363,787 513,575 $51.1$1,504,538 $349,59 $25,98 51,9-51 54742 5653,184 67initial imetment NPV Analysis Grid: NPV v Disenunt Rat&Yexr 1 Sales Ranges net cash tlow ales Yr. Bales Yrl Base Bales Yrl aks Yr. 306 Sales Yr 430,500 Salus Y.l 1036 NPV in Cas 149492 3512 $992,3 $1,394 hi5,l11 $490,101 PV net cash flow net cash flow $661,444 $49291 $1,175,47 924,0 5792,12 S1.004, 10 $812,6 $190,64
Step by Step Solution
There are 3 Steps involved in it

Get step-by-step solutions from verified subject matter experts