

Question: 3 . 1 2 ( a ) Using the batch flux plot data given in Table 3 E 1 2 . 1 , graphically determine
a Using the batch flux plot data given in Table E graphically determine the
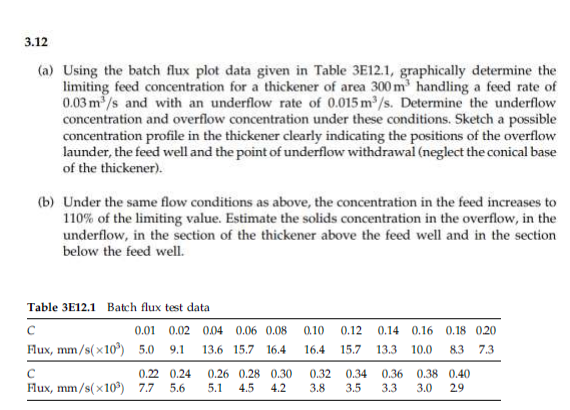
limiting feed concentration for a thickener of area handling a feed rate of
and with an underflow rate of Determine the underflow
concentration and overflow concentration under these conditions. Sketch a possible
concentration profile in the thickener clearly indicating the positions of the overflow
launder, the feed well and the point of underflow withdrawal neglect the conical base
of the thickener
b Under the same flow conditions as above, the concentration in the feed increases to
of the limiting value. Estimate the solids concentration in the overflow, in the
underflow, in the section of the thickener above the feed well and in the section
below the feed well.
Table E Batch flux test data
Step by Step Solution
There are 3 Steps involved in it
1 Expert Approved Answer
Step: 1 Unlock

Question Has Been Solved by an Expert!
Get step-by-step solutions from verified subject matter experts
Step: 2 Unlock
Step: 3 Unlock