

Question: 3) (10 pts) Figures (a), (b), (c) and (d) are normal probability plot (QQ plot) of a data a. Compare figures (c) and (d) in
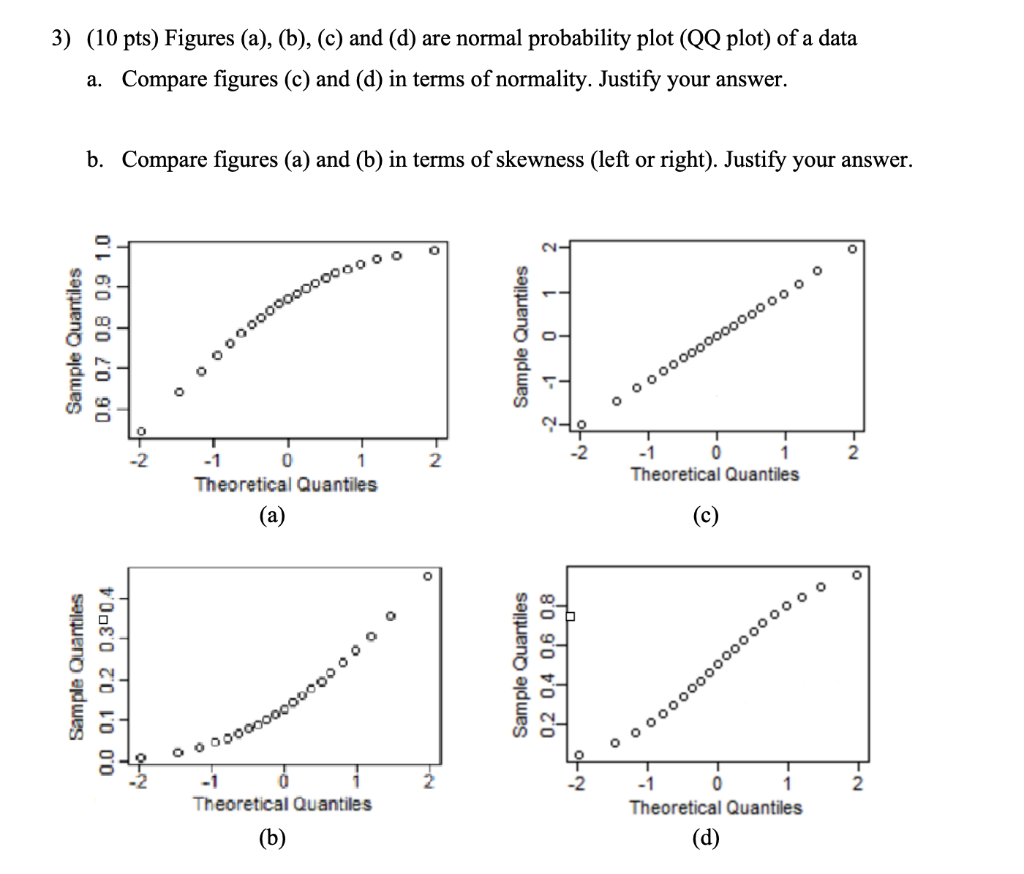
3) (10 pts) Figures (a), (b), (c) and (d) are normal probability plot (QQ plot) of a data a. Compare figures (c) and (d) in terms of normality. Justify your answer. b. Compare figures (a) and (b) in terms of skewness (left or right). Justify your answer. 3 0.6 0.7 0.8 0.9 1.0 0 0 0 09000090090060 0 Sample Quantiles Sample Quantiles O- 0 0 000000000000060 0 -2 -1 -2 -1 2 -1 0 Theoretical Quantiles Theoretical Quantiles (a) (c) O O Sample Quantiles Sample Quantiles 02 04 0,6 08 0 09090009009060. . 0.0 0.1 0.2 0.390.4 60 0900090909090.. . . N-to -1 2 Theoretical Quantiles Theoretical Quantiles (b) (d)
Step by Step Solution
There are 3 Steps involved in it
1 Expert Approved Answer
Step: 1 Unlock

Question Has Been Solved by an Expert!
Get step-by-step solutions from verified subject matter experts
Step: 2 Unlock
Step: 3 Unlock