

Question: 3. A contour diagram for the function z =f(x, y) is drawn below. The level curves are spaced at intervals of z = 1. You
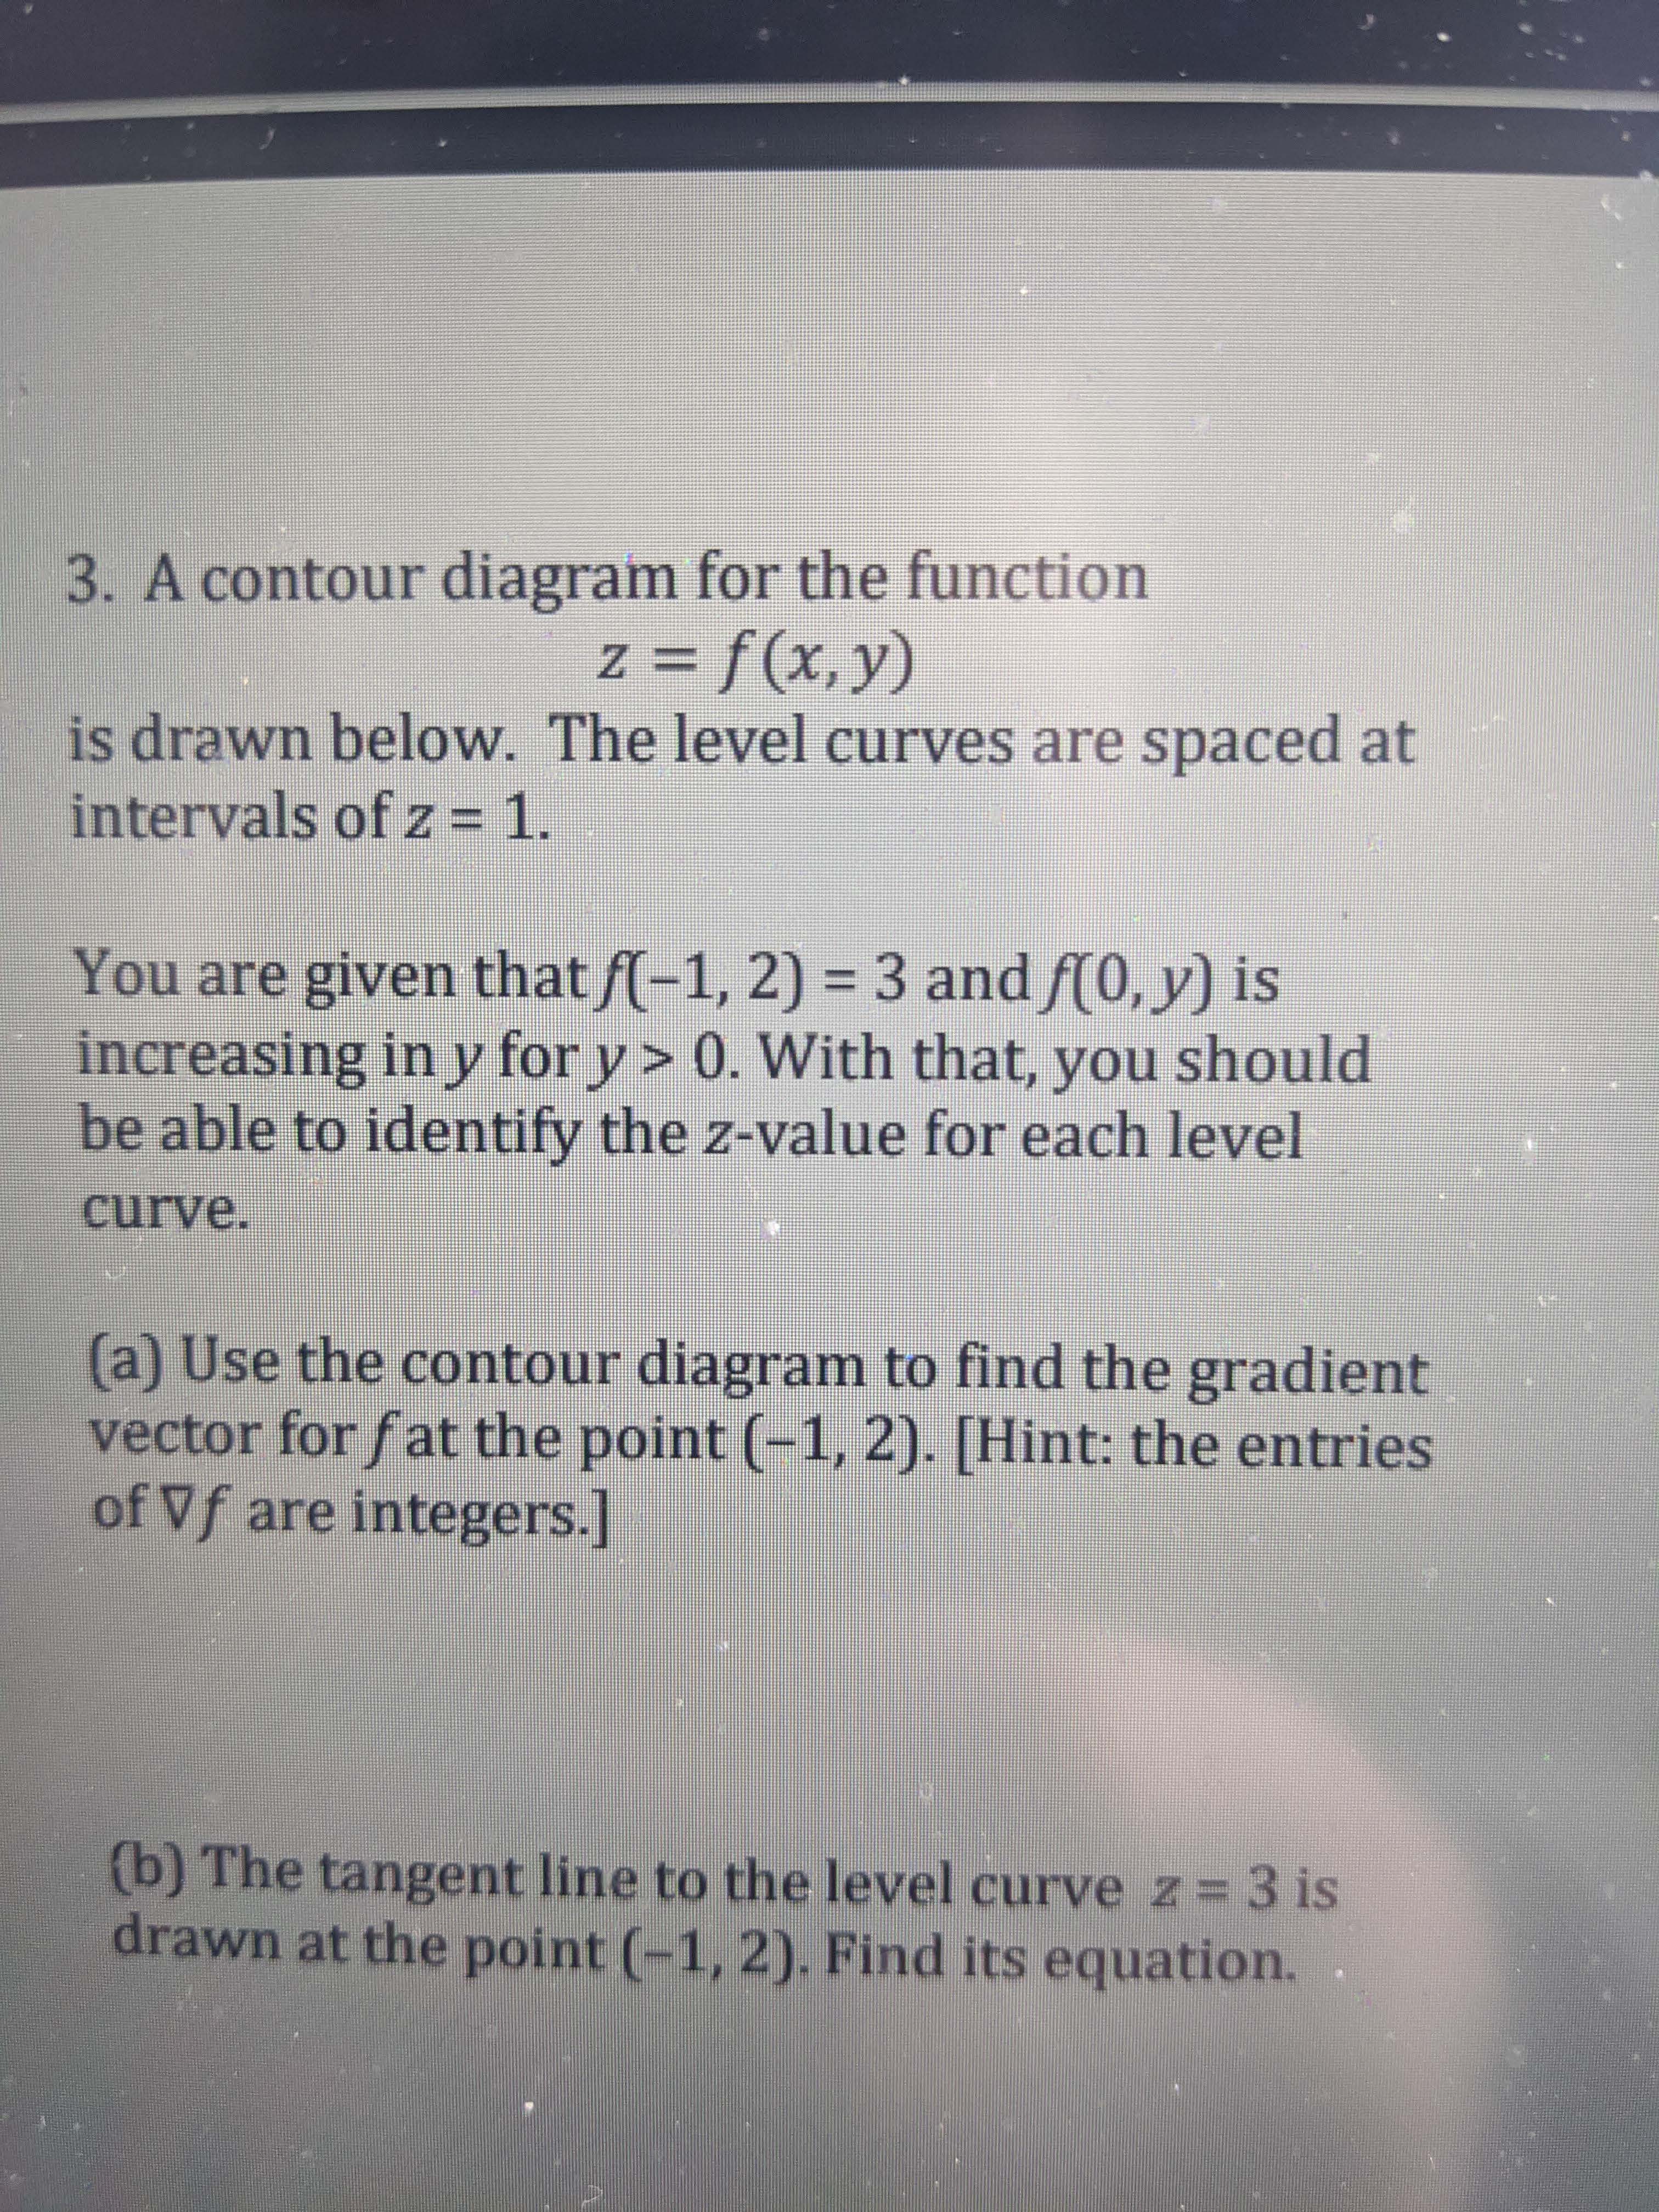
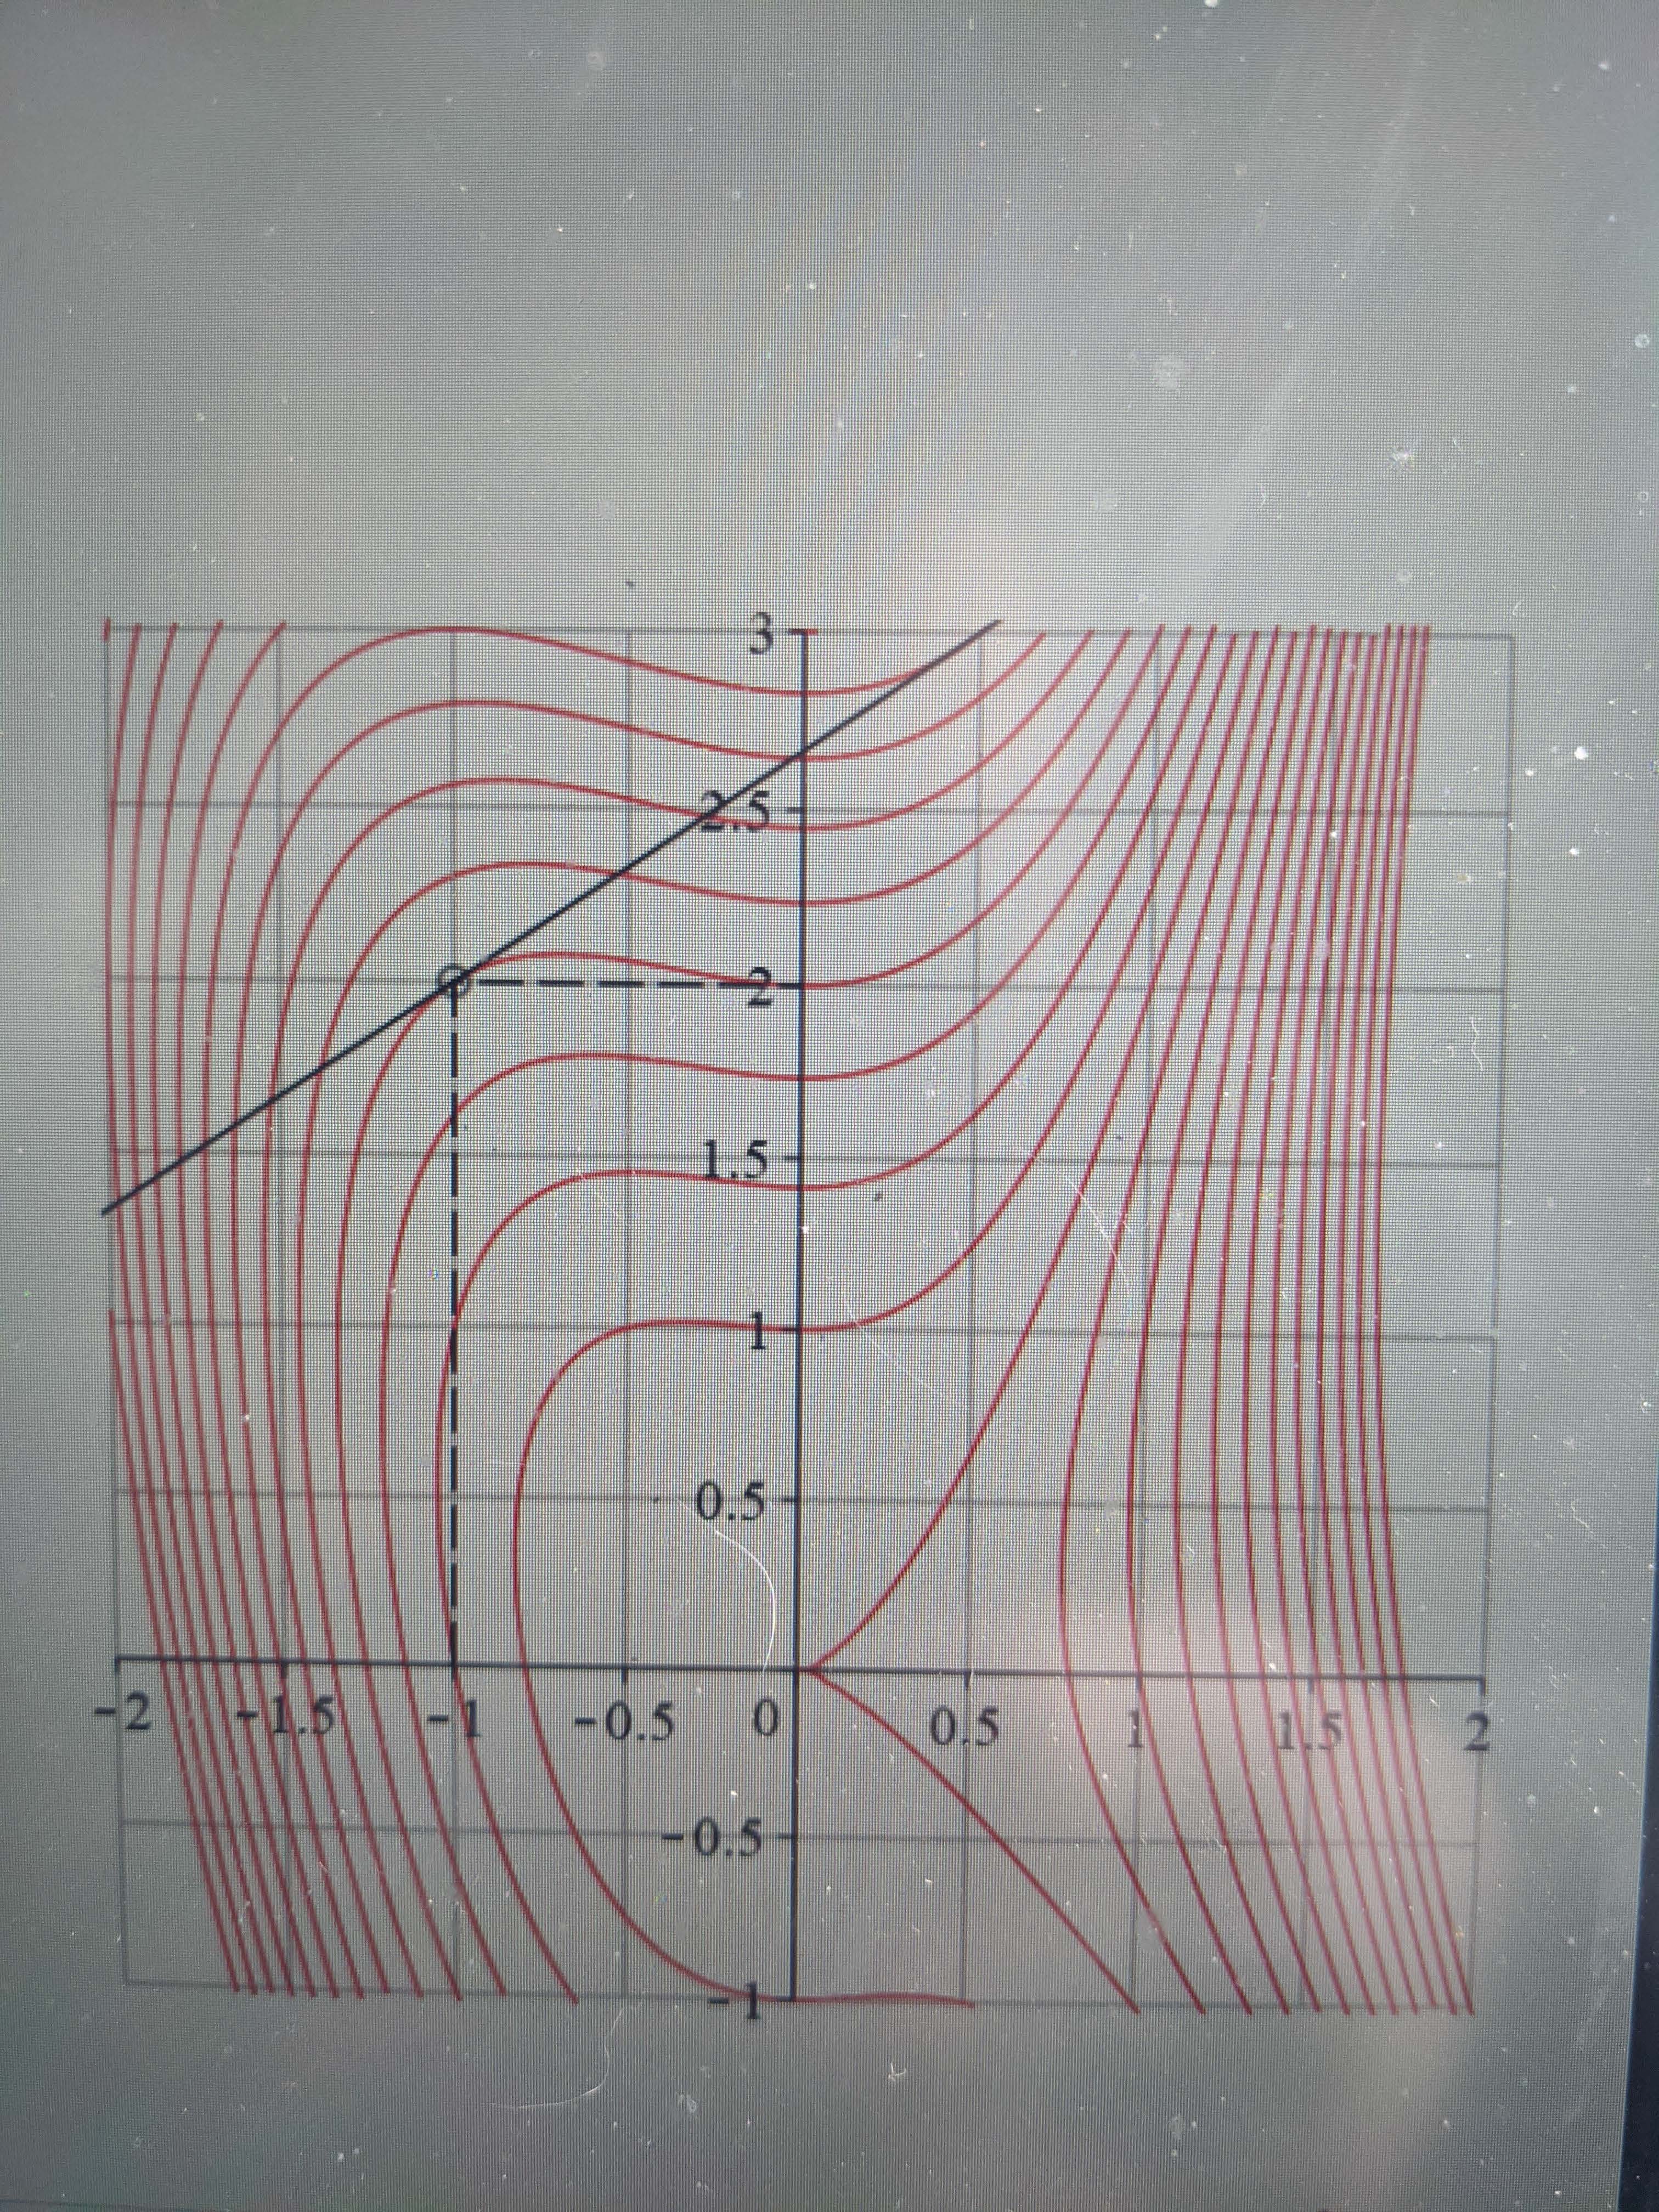
3. A contour diagram for the function z =f(x, y) is drawn below. The level curves are spaced at intervals of z = 1. You are given that f(-1, 2) = 3 and f(0, y) is increasing in y fory > 0. With that, you should be able to identify the z-value for each level curve. (a) Use the contour diagram to find the gradient vector for fat the point (-1, 2). [Hint: the entries of Vf are integers.] (b) The tangent line to the level curve z = 3 is drawn at the point (-1, 2). Find its equation.1.5 - 0.5 - 2 0.5 0 0.5 -0.5
Step by Step Solution
There are 3 Steps involved in it
1 Expert Approved Answer
Step: 1 Unlock

Question Has Been Solved by an Expert!
Get step-by-step solutions from verified subject matter experts
Step: 2 Unlock
Step: 3 Unlock