

Question: 3. Prior to solving this problem you should watch the Center of Gravity and Bubble Chart (in the same folder as this document) and duplicate
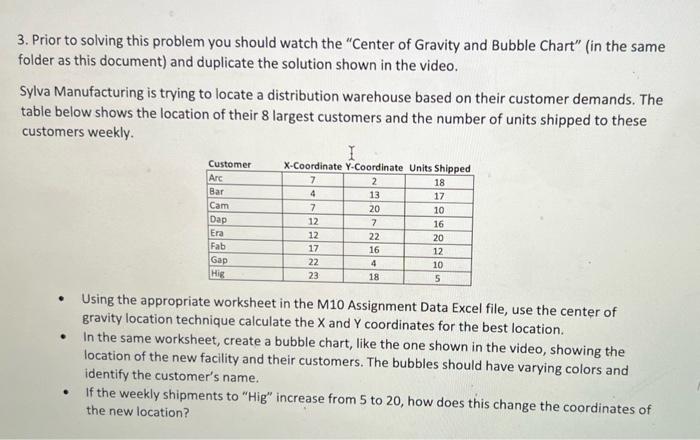
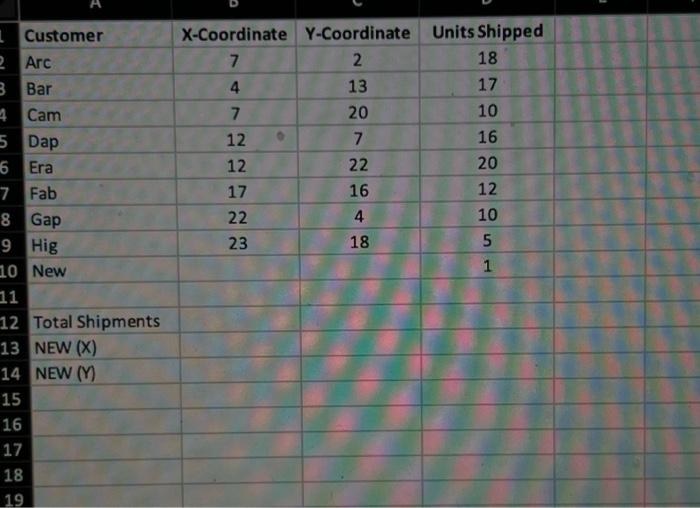

3. Prior to solving this problem you should watch the "Center of Gravity and Bubble Chart" (in the same folder as this document) and duplicate the solution shown in the video. Sylva Manufacturing is trying to locate a distribution warehouse based on their customer demands. The table below shows the location of their 8 largest customers and the number of units shipped to these customers weekly. - Using the appropriate worksheet in the M10 Assignment Data Excel file, use the center of gravity location technique calculate the X and Y coordinates for the best location. - In the same worksheet, create a bubble chart, like the one shown in the video, showing the location of the new facility and their customers. The bubbles should have varying colors and identify the customer's name. - If the weekly shipments to "Hig" increase from 5 to 20 , how does this change the coordinates of the new location? Total Shipments NEW (X) NEW (Y) Paste the bubble chart, with required formatting as a picture (not Excel object) below: If the weekly shlpments to "Hlx" Increase from 5 to 20, how does this change the coordinates of the new location
Step by Step Solution
There are 3 Steps involved in it

Get step-by-step solutions from verified subject matter experts