

Question: 3. The data in the table are based on the results of a survey comparing the commute time of adults to their score on a


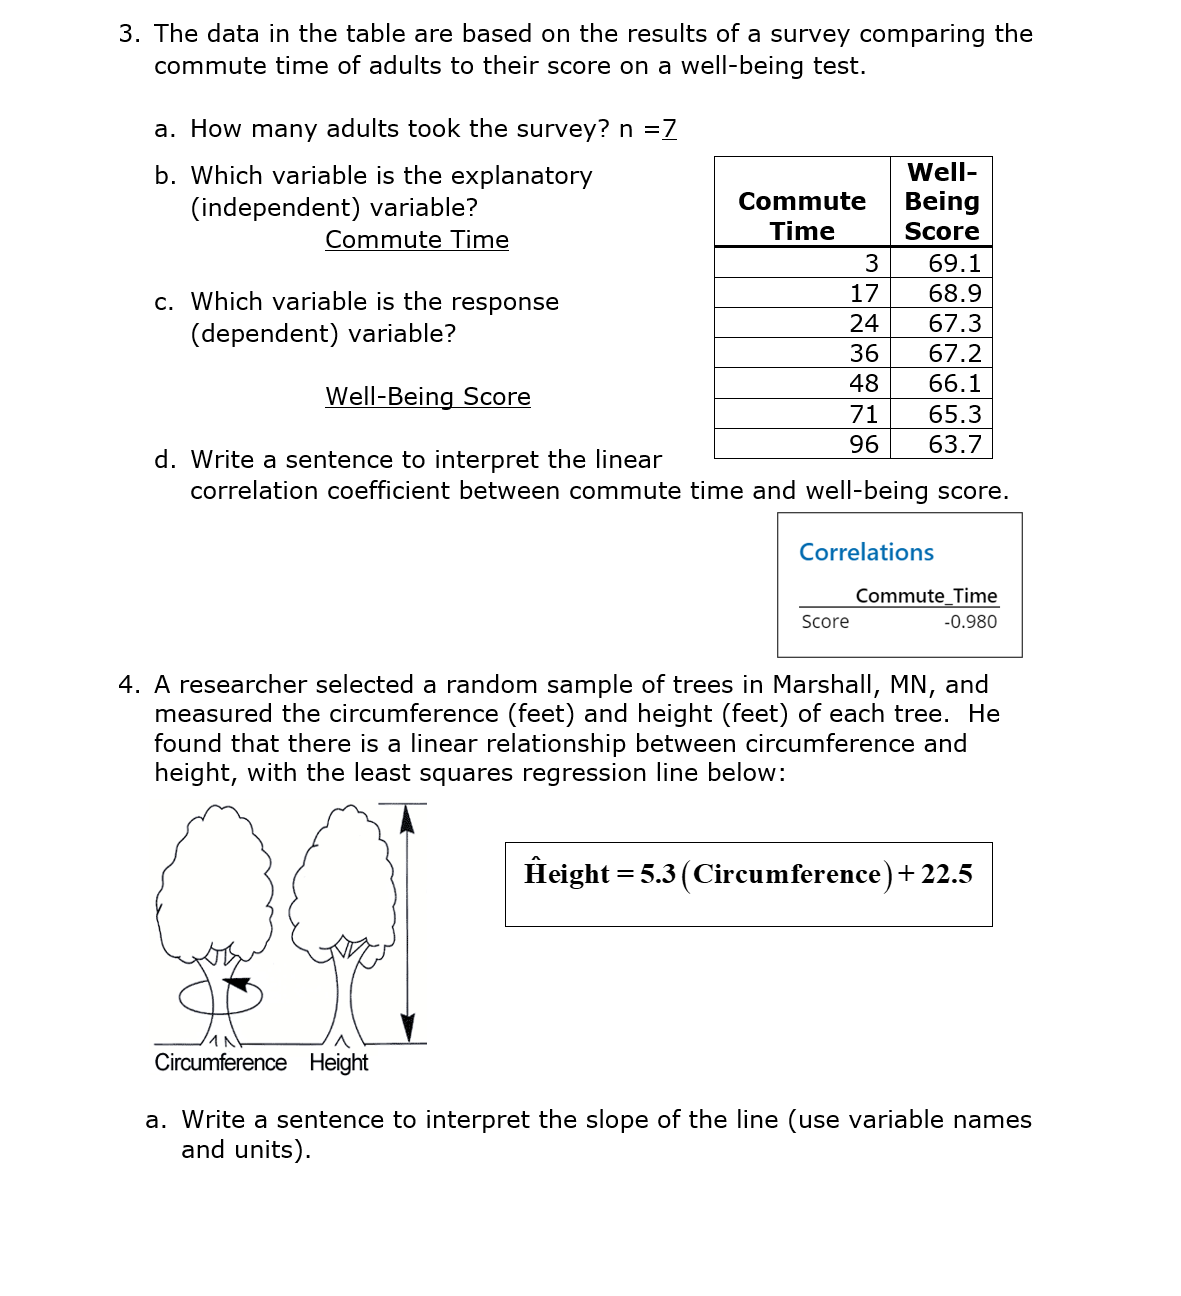
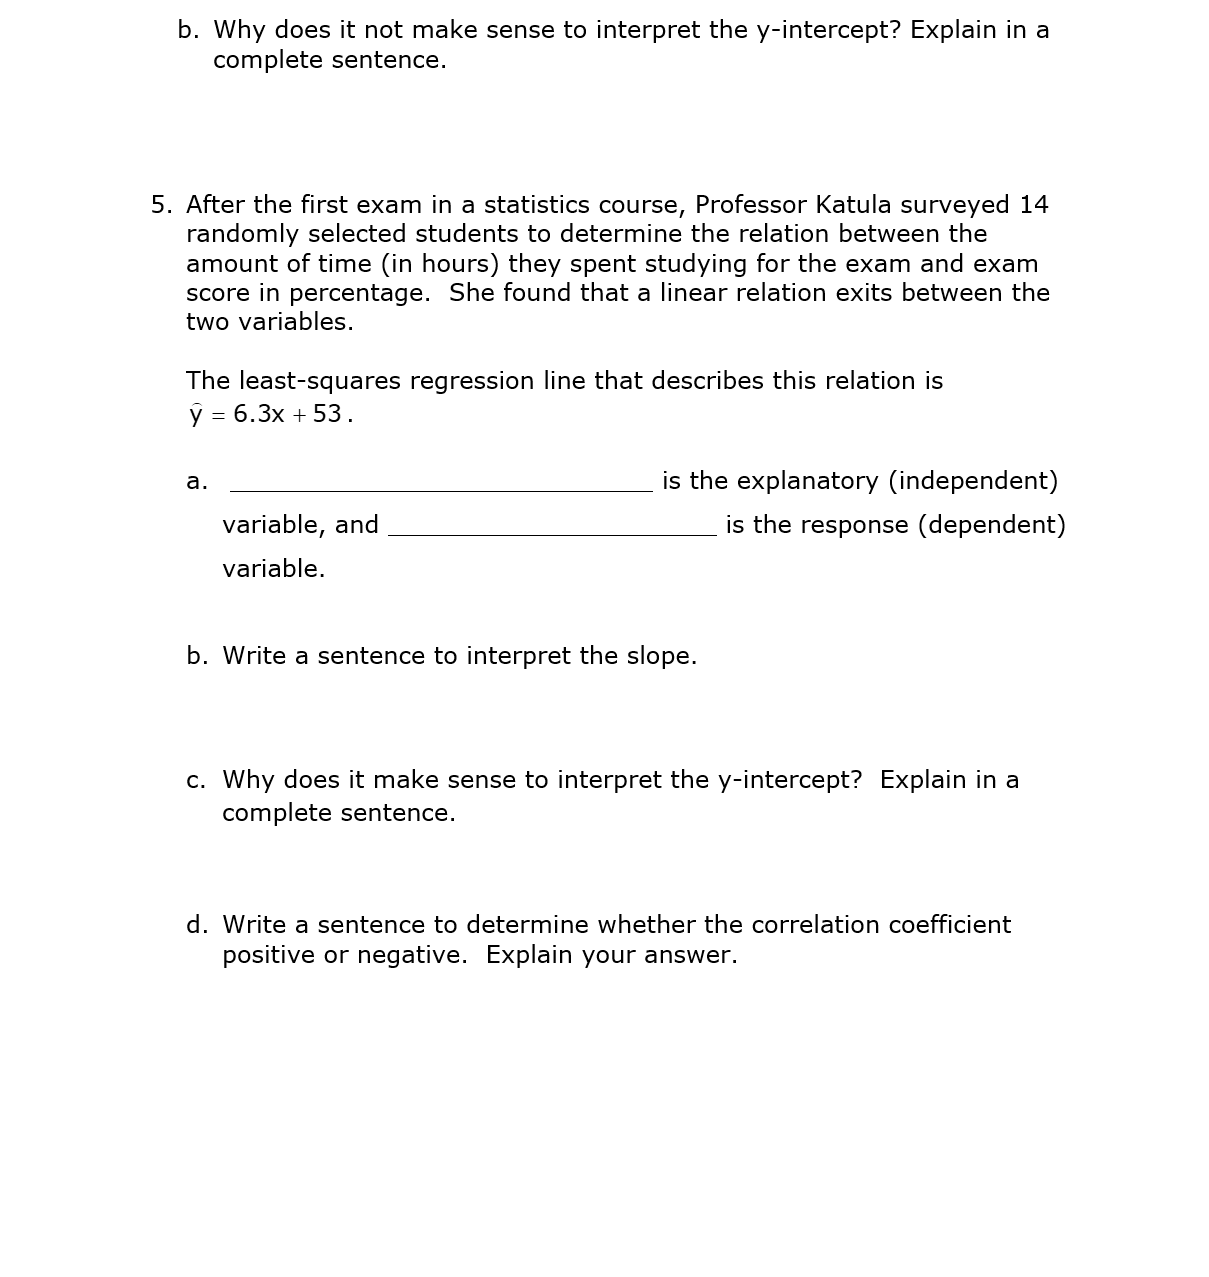
3. The data in the table are based on the results of a survey comparing the commute time of adults to their score on a well-being test. a. How many adults took the survey? n =2 b. Which variable is the explanatory (independent) variable? Commute Time c. Which variable is the response (dependent) variable? WellBeing Score d. Write a sentence to interpret the linear Well- Commute Being Time Score 3 69.1 17 68.9 24 67.3 36 67.2 48 66.1 71 65.3 96 63.7 correlation coefficient between commute time and well-being score. Score Correlations CommuteiTime -O.980 4. A researcher selected a random sample of trees in Marshall, MN, and measured the circumference (feet) and height (feet) of each tree. He found that there is a linear relationship between circumference and height, with the least squares regression line below: eight = 5.3 (Circumference) -l- 22.5 4 ix /\\ Circumference Height a. Write a sentence to interpret the slope of the line (use variable names and units). b. Why does it not make sense to interpret the y-intercept? Explain in a complete sentence. 5. After the first exam in a statistics course, Professor Katula surveyed 14 randomly selected students to determine the relation between the amount of time (in hours) they spent studying for the exam and exam score in percentage. She found that a linear relation exits between the two variables. The least-squares regression line that describes this relation is y : 6.3x + 53. a. is the explanatory (independent) variable, and is the response (dependent) variable. b. Write a sentence to interpret the slope. c. Why does it make sense to interpret the y-intercept? Explain in a complete sentence. d. Write a sentence to determine whether the correlation coefficient positive or negative. Explain your
Step by Step Solution
There are 3 Steps involved in it

Get step-by-step solutions from verified subject matter experts