

Question: The data in the table to the right are based on the results of a survey comparing the commute time of adults to their score

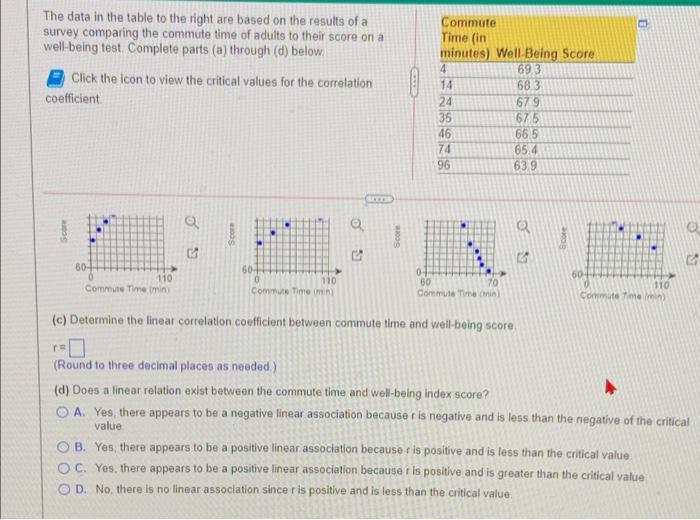
The data in the table to the right are based on the results of a survey comparing the commute time of adults to their score on a well-being test. Complete parts (a) through (d) below. Click the icon to view the critical values for the correlation coefficient Commute Time (in minutes) Well Being Score 4 693 14 68.3 24 679 35 67 46 66.5 74 654 96 639 (a) Which variable is likely the explanatory variable and which is the response variable? O A. The explanatory variable is the well-being score and the response variable is commute time because well-being score affects the commute time OB. The explanatory variable is commute time and the response variable is the well-being score because well-being score affects the commute time score OC. The explanatory variable is commute time and the response variable is the well-being score because commute time affects the well-being score. OD. The explanatory variable is the well-being score and the response variable is commute time because commute time affects the well-being score (b) Draw a scatter diagram of the data which of the following represents the data? OA B OC. OD a a 70 TO 110 70 a o . LA The data in the table to the right are based on the results of a survey comparing the commute time of adults to their score on a well-being test Complete parts (a) through (d) below Click the icon to view the critical values for the correlation coefficient Commute Time (in minutes) Well Being Score 4 69.3 14 683 24 679 35 675 46 665 74 65.4 96 63.9 a Score @ Score co 5. 80+ 507 110 Commute Time min 60-1 0 Commute Time 110 0 50 Commuter 70 110 Comitato) (c) Determine the linear correlation coefficient between commute time and well-being score re (Round to three decimal places as needed) (a) Does a linear relation exist between the commute time and well-being index score? O A. Yes, there appears to be a negative linear association because r is negative and is less than the negative of the critical value OB. Yes, there appears to be a positive linear association because r is positive and is less than the critical value OC. Yes, there appears to be a positive linear association because ris positive and is greater than the critical value OD. No, there is no linear association sincer is positive and is less than the critical value
Step by Step Solution
There are 3 Steps involved in it

Get step-by-step solutions from verified subject matter experts