

Question: 3 The data in the table to the right are based on the results of a survey Commute Time Well-Being comparing the commute time of

3
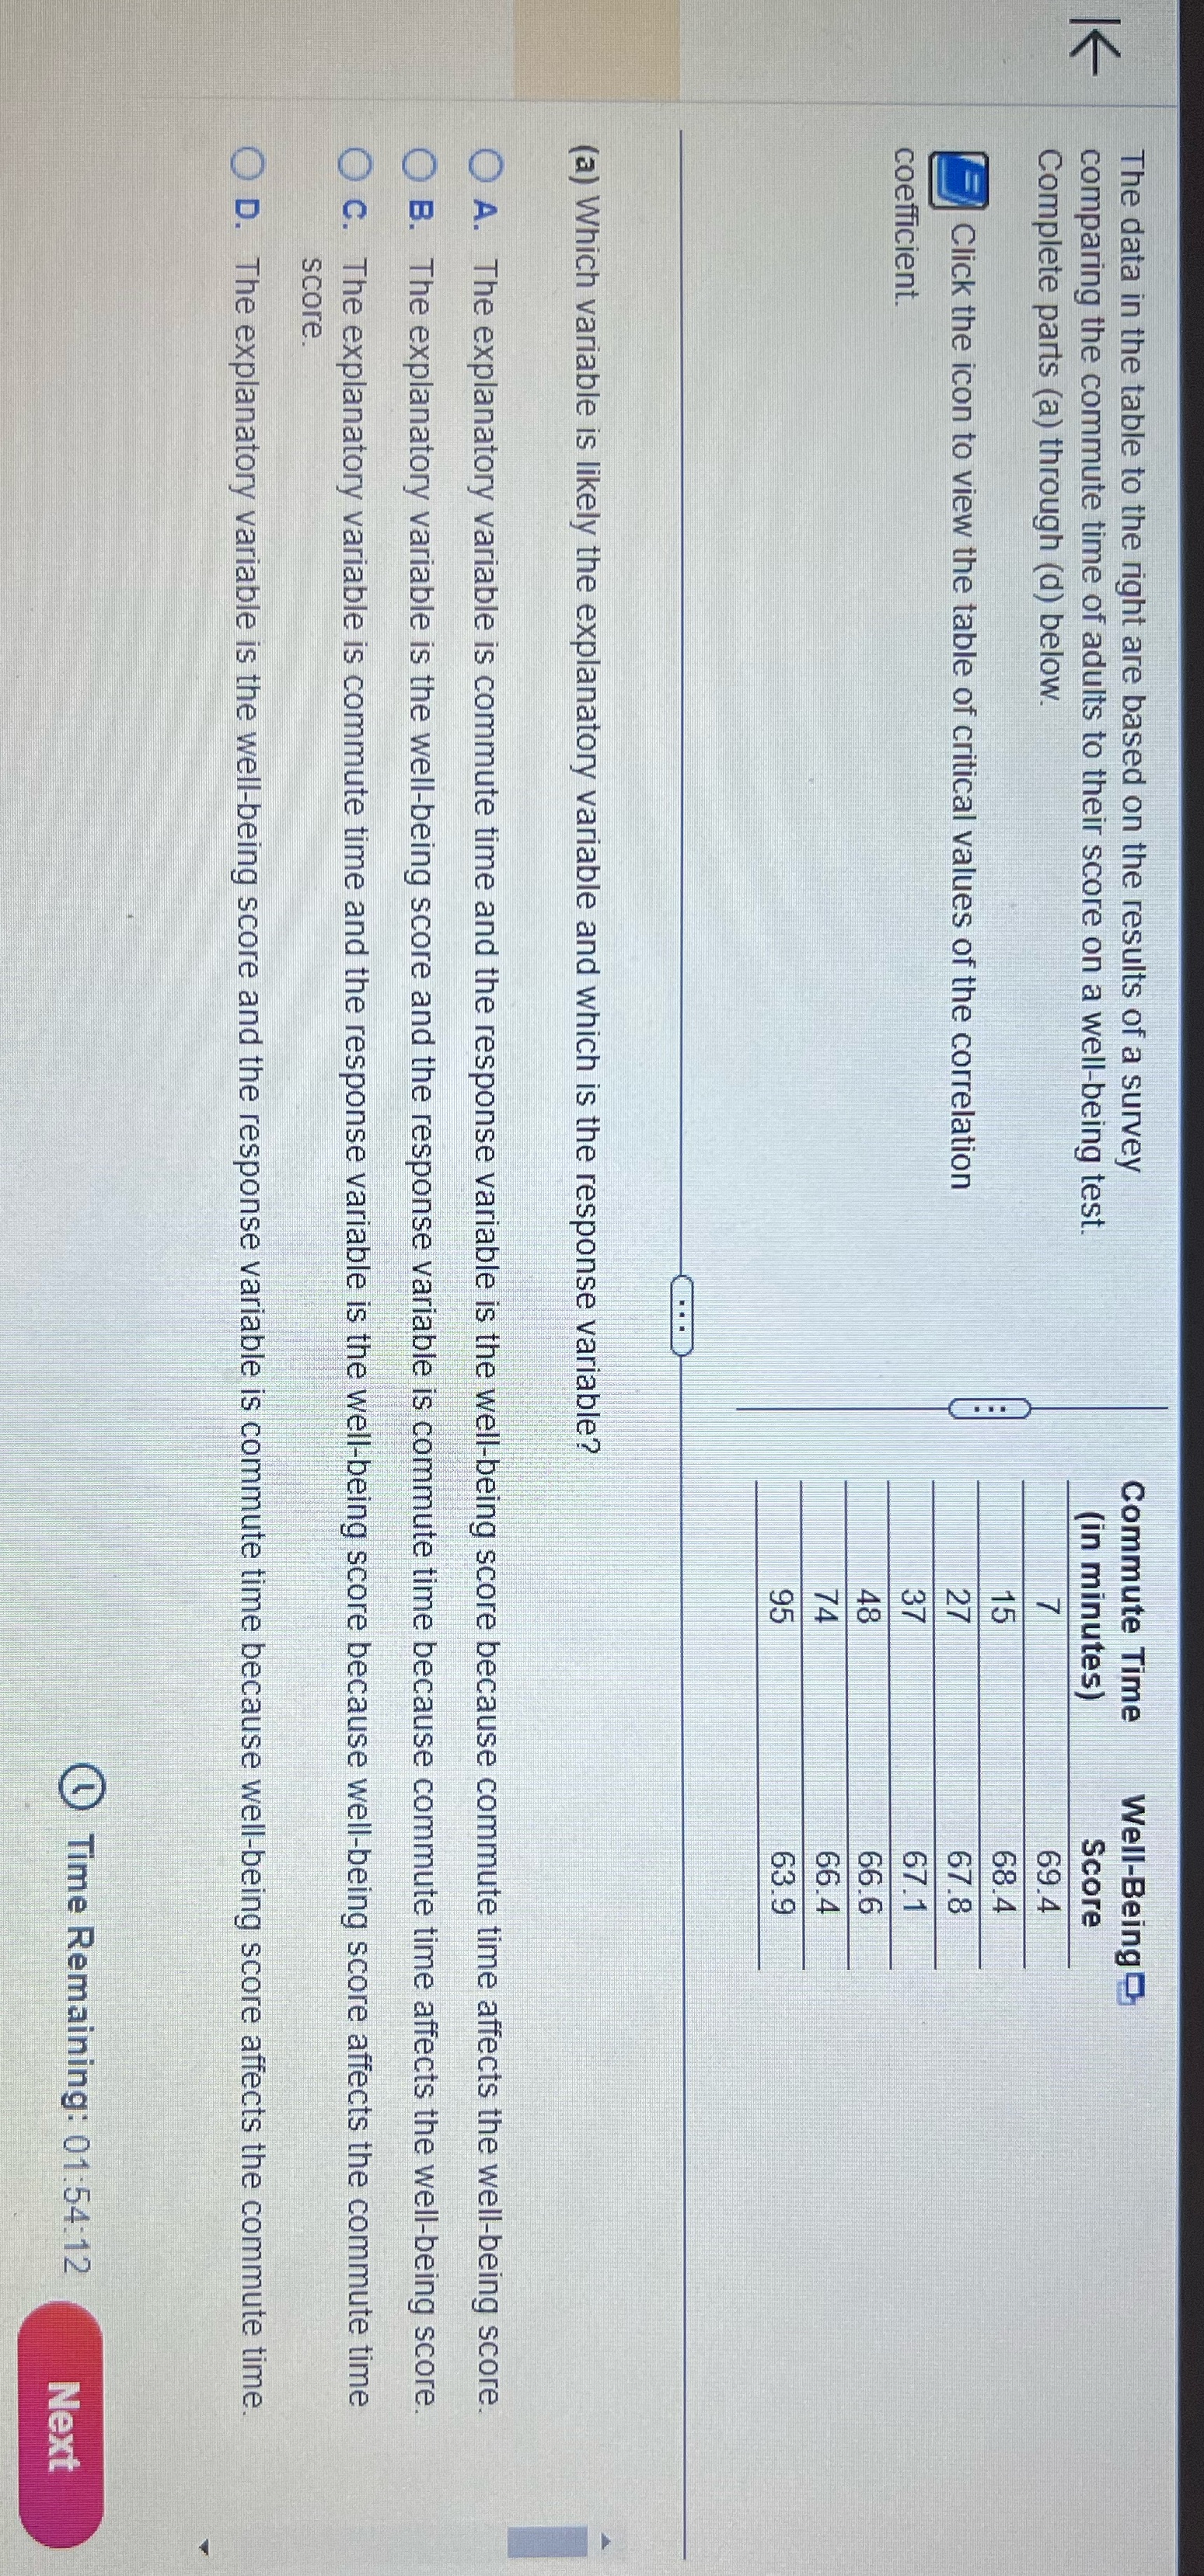
The data in the table to the right are based on the results of a survey Commute Time Well-Being comparing the commute time of adults to their score on a well-being test. (in minutes) Score Complete parts (a) through (d) below. 69.4 68.4 Click the icon to view the table of critical values of the correlation 67.8 coefficient. 67.1 66.6 66.4 63.9 (a) Which variable is likely the explanatory variable and which is the response variable? O A. The explanatory variable is commute time and the response variable is the well-being score because commute time affects the well-being score. O B. The explanatory variable is the well-being score and the response variable is commute time because commute time affects the well-being score. O C. The explanatory variable is commute time and the response variable is the well-being score because well-being score affects the commute time score. O D. The explanatory variable is the well-being score and the response variable is commute time because well-being score affects the commute time. ) Time Remaining: 01:54:12 Next
Step by Step Solution
There are 3 Steps involved in it

Get step-by-step solutions from verified subject matter experts