

Question: 3. The data on the next page represents the number of Total COVID-19 cases in the US from March 1, 2020 to April 1, 2020.
3. The data on the next page represents the number of Total COVID-19 cases in the US from March 1, 2020 to April 1, 2020.
a. Find an exponential regression for the data of the form = . Make sure you clearly define your variables.
b. Provide a neat graph of your function. This can be a screen shot/clip of Desmos but make sure it is well labeled.
c. Explain what the a and b values mean in context.
. Using your regression function, how many people would have contracted COVID-19 by April 15?
e. The population of the United States is about 331 million. Use your function to estimate the date when all 331 million people would have contracted COVID-19. f. Calculate the average rate of change from March 1 to March 2 and compare it to the average rate of change from March 30 to March 31. Explain the meaning of these values
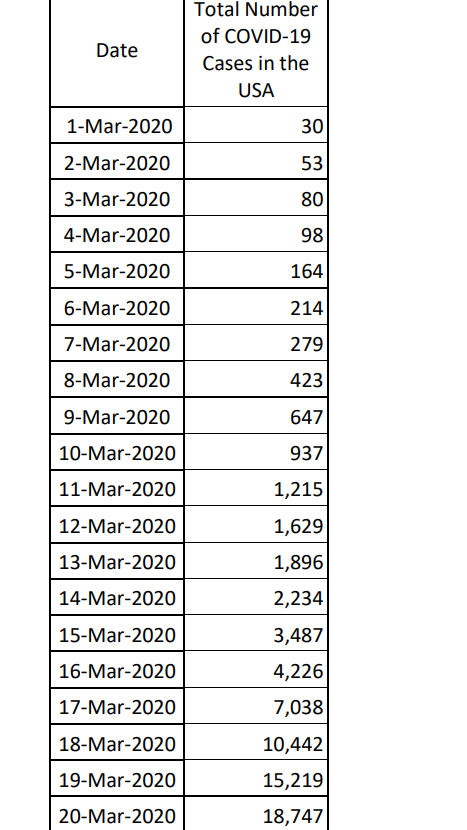
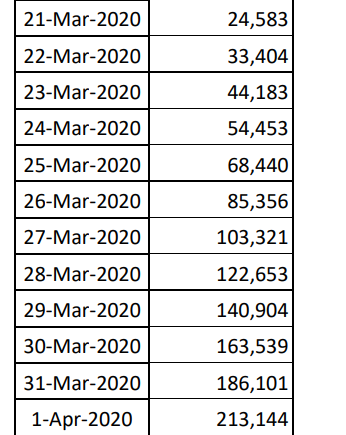
Date Total Number of COVID-19 Cases in the USA 1-Mar-2020 30 2-Mar-2020 53 3-Mar-2020 80 4-Mar-2020 98 5-Mar-2020 164 6-Mar-2020 214 7-Mar-2020 279 8-Mar-2020 423 9-Mar-2020 647 10-Mar-2020 937 11-Mar-2020 1,215 12-Mar-2020 1,629 13-Mar-2020 1,896 2,234 14-Mar-2020 15-Mar-2020 3,487 16-Mar-2020 4,226 17-Mar-2020 7,038 18-Mar-2020 10,442 19-Mar-2020 15,219 20-Mar-2020 18,747 21-Mar-2020 24,583 22-Mar-2020 33,404 23-Mar-2020 44,183 24-Mar-2020 54,453 25-Mar-2020 68,440 26-Mar-2020 85,356 103,321 27-Mar-2020 28-Mar-2020 122,653 29-Mar-2020 140,904 30-Mar-2020 163,539 31-Mar-2020 186,101 1-Apr-2020 213,144
Step by Step Solution
There are 3 Steps involved in it

Get step-by-step solutions from verified subject matter experts