

Question: 3. The following graphs ( 3a,3b, and 3c) show elevation on the y-axis and air temperature on the x-axis. The solid line indicates the ambient
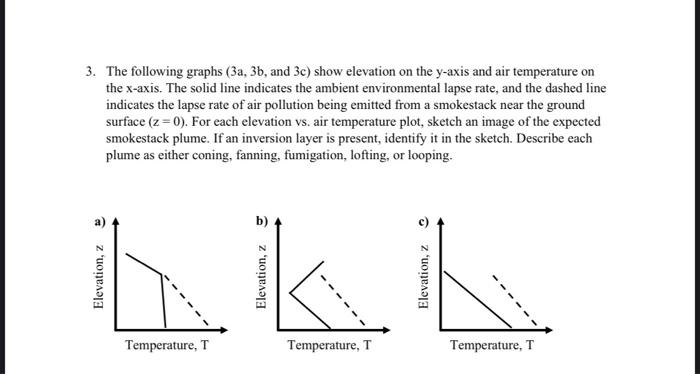
3. The following graphs ( 3a,3b, and 3c) show elevation on the y-axis and air temperature on the x-axis. The solid line indicates the ambient environmental lapse rate, and the dashed line indicates the lapse rate of air pollution being emitted from a smokestack near the ground surface (z=0). For each elevation vs. air temperature plot, sketch an image of the expected smokestack plume. If an inversion layer is present, identify it in the sketch. Describe each plume as either coning, fanning, fumigation, lofting, or looping
Step by Step Solution
There are 3 Steps involved in it
1 Expert Approved Answer
Step: 1 Unlock

Question Has Been Solved by an Expert!
Get step-by-step solutions from verified subject matter experts
Step: 2 Unlock
Step: 3 Unlock