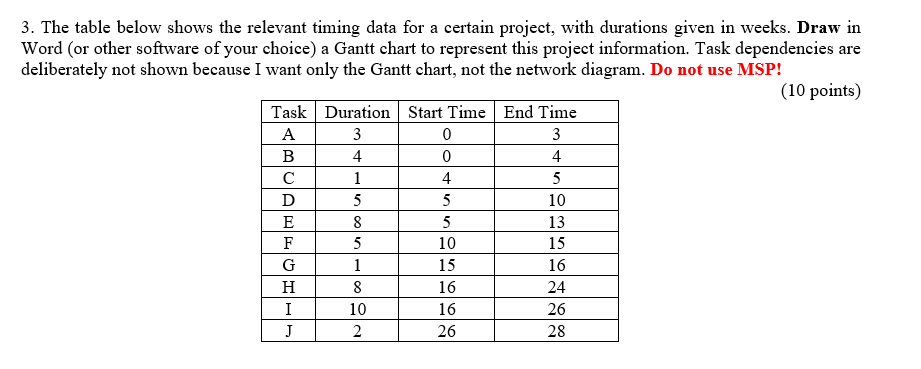
Question: 3. The table below shows the relevant timing data for a certain project, with durations given in weeks. Draw in Word (or other software of

3. The table below shows the relevant timing data

3. The table below shows the relevant timing data for a certain project, with durations given in weeks. Draw in Word (or other software of your choice) a Gantt chart to represent this project information. Task dependencies are deliberately not shown because I want only the Gantt chart, not the network diagram. Do not use MSP! (10 points) Task Duration Start Time End Time A 3 0 3 B 4 0 4 1 4 5 D 5 5 10 E 8 5 13 F 5 10 15 G 1 15 16 H 8 16 24 I 10 16 26 J 2 26 28

Step by Step Solution

There are 3 Steps involved in it

1 Expert Approved Answer
Step: 1 Unlock blur-text-image
Question Has Been Solved by an Expert!

Get step-by-step solutions from verified subject matter experts

Step: 2 Unlock
Step: 3 Unlock

Students Have Also Explored These Related General Management Questions!