

Question: 3. The v-t graph for a train has been experimentally determined. From the data, construct the s-t and a-t graphs for the motion for
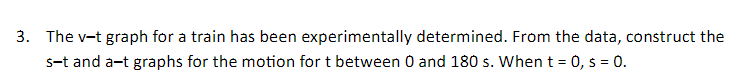
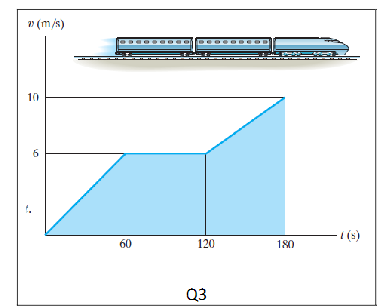
3. The v-t graph for a train has been experimentally determined. From the data, construct the s-t and a-t graphs for the motion for t between 0 and 180 s. When t = 0, s = 0. 10 50 6 (m/s) 1(5) 60 120 180 Q3
Step by Step Solution
There are 3 Steps involved in it
1 Expert Approved Answer
Step: 1 Unlock

Question Has Been Solved by an Expert!
Get step-by-step solutions from verified subject matter experts
Step: 2 Unlock
Step: 3 Unlock