

Question: The v-t graph for a train has been experimentally determined. From the data, construct the s-t and a-t graphs for the motion for 0
The v-t graph for a train has been experimentally determined. From the data, construct the s-t and a-t graphs for the motion for 0 ≤ t ≤ 180 s. When t=0,s=0.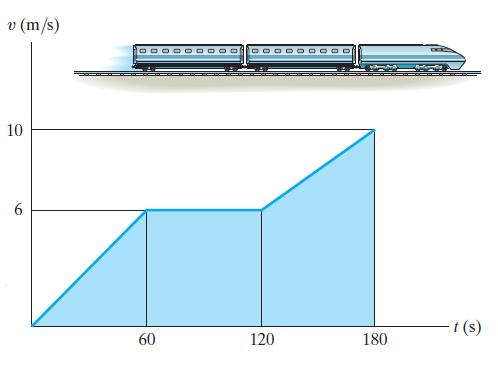
v (m/s) 10 6 60 120 180 ... ... t (s)
Step by Step Solution
★★★★★
3.37 Rating (163 Votes )
There are 3 Steps involved in it
1 Expert Approved Answer
Step: 1 Unlock

st Graph The st function can be determined by integrati... View full answer
Question Has Been Solved by an Expert!
Get step-by-step solutions from verified subject matter experts
Step: 2 Unlock
Step: 3 Unlock