

Question: The s-t graph for a train has been experimentally determined. From the data, construct the v-t and a-t graphs for the motion; 0 t
The s-t graph for a train has been experimentally determined. From the data, construct the v-t and a-t graphs for the motion; 0 ≤ t ≤ 40 s. For 0 ≤ t 30 s.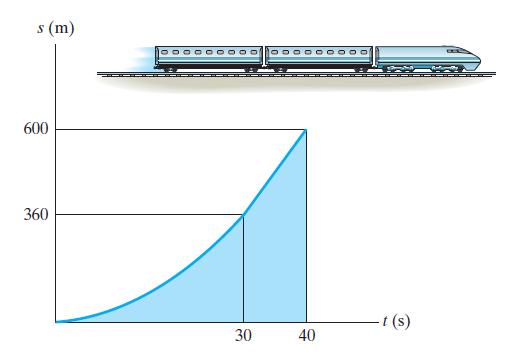
s (m) 600 360 30 40 -t (s) CEL H
Step by Step Solution
★★★★★
3.58 Rating (176 Votes )
There are 3 Steps involved in it
1 Expert Approved Answer
Step: 1 Unlock

0 t 30 S s 041 V a ds dt ... View full answer
Question Has Been Solved by an Expert!
Get step-by-step solutions from verified subject matter experts
Step: 2 Unlock
Step: 3 Unlock