

Question: 3. Write the R code that will create each of the plots below. You will need ggplot2 code, and you may also need dplyr code
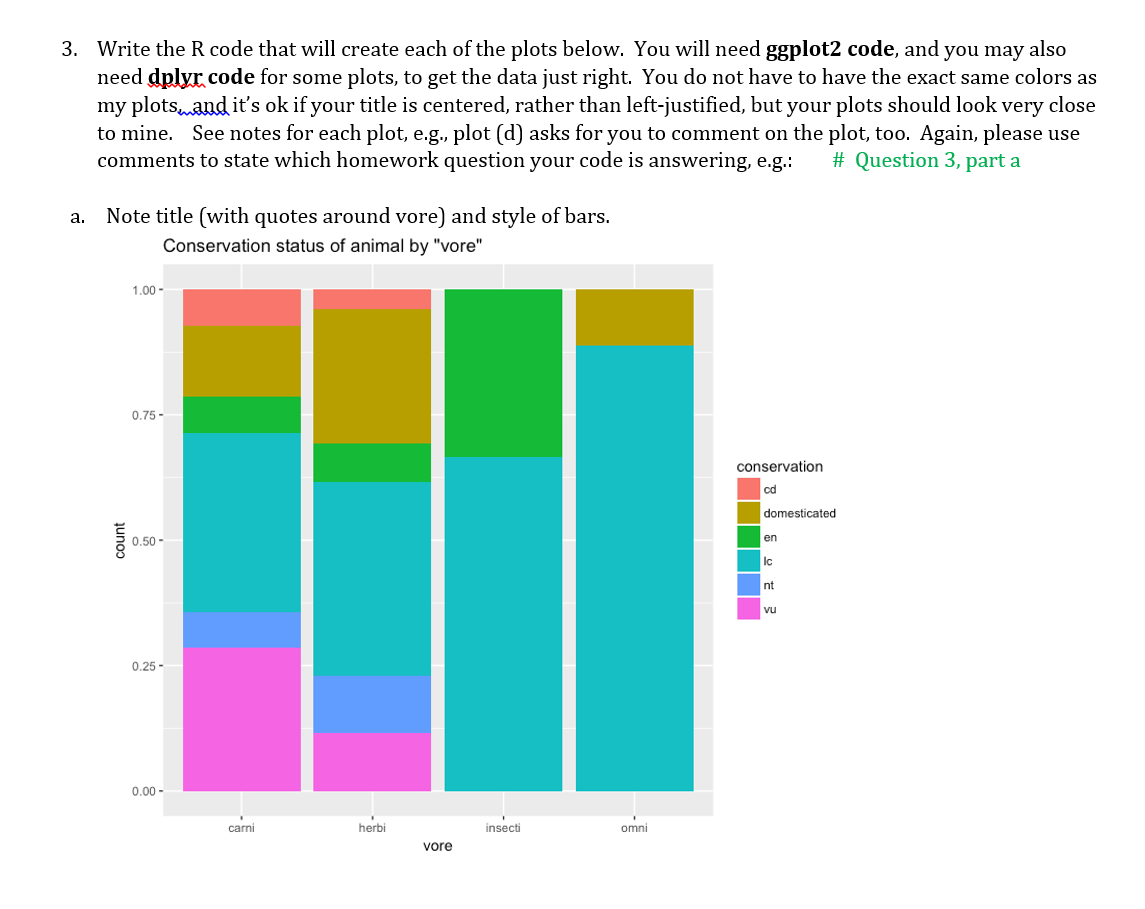
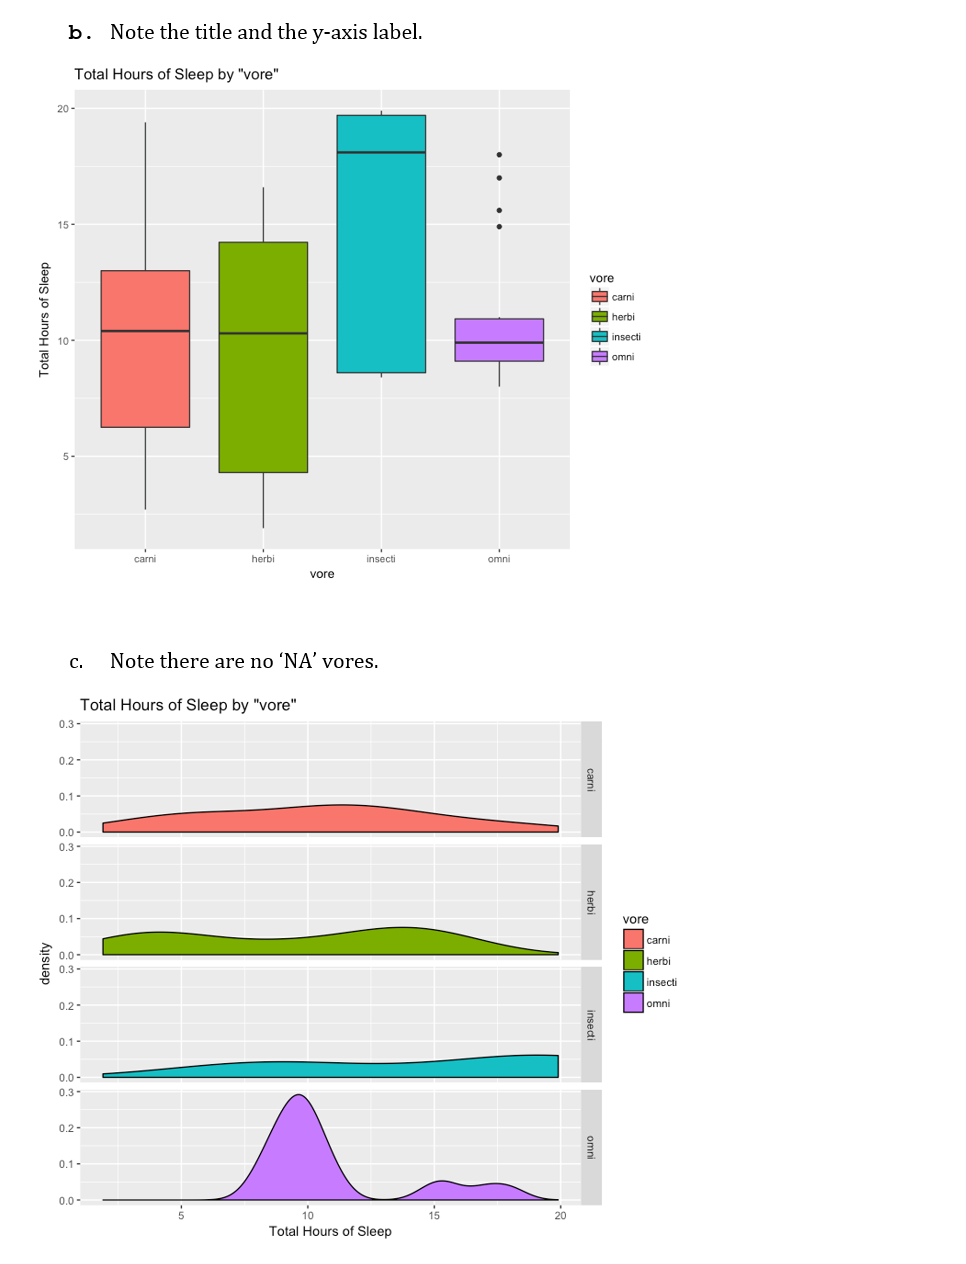
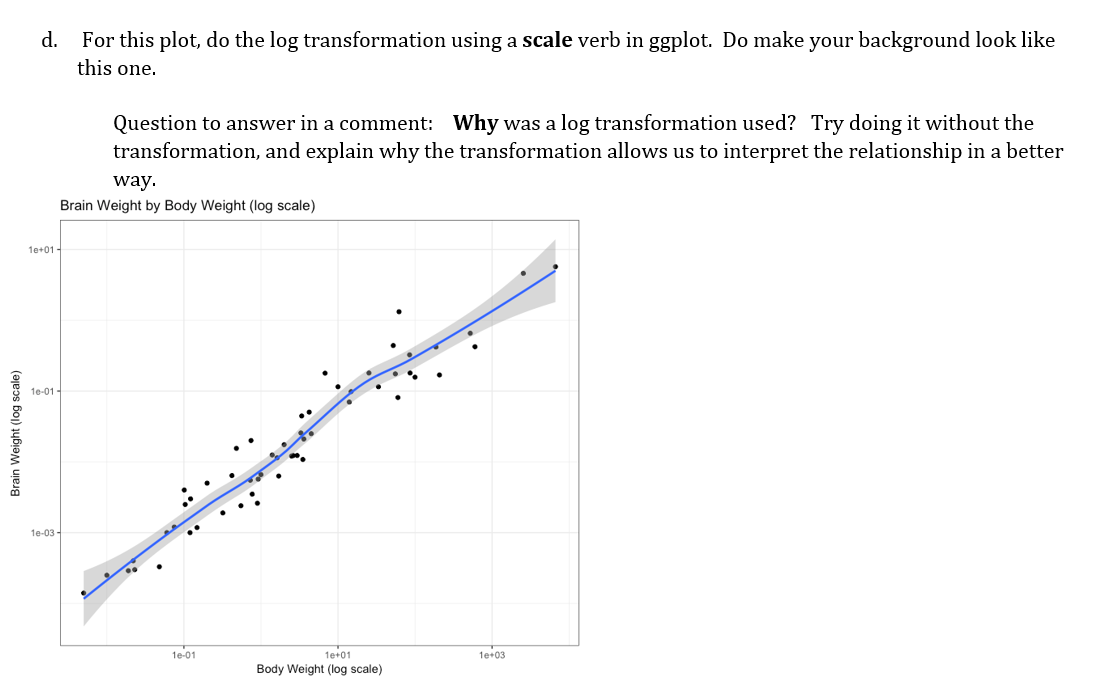
3. Write the R code that will create each of the plots below. You will need ggplot2 code, and you may also need dplyr code for some plots, to get the data just right. You do not have to have the exact same colors as my plotswand it's ok if your title is centered, rather than left-justified, but your plots should look very close to mine. See notes for each plot, e.g., plot (d) asks for you to comment on the plot, too. Again, please use comments to state which homework question your code is answering, e.g.: # Question 3, part a a. Note title (with quotes around vore) and style of bars. Conservation status of animal by "vore" 1.00 - 0.75 - conservation Od domesticated count 0.25 - 0.00 - carni herbi insecti omni vore b. Note the title and the y-axis label. Total Hours of Sleep by "vore" Total Hours of Sleep vore B carni herbi B insecti omni herbi insecti omni vore c. Note there are no 'NA' vores. Total Hours of Sleep by "vore" carni herbi vore carni density herbi insecti omni insecti omni 15 Total Hours of Sleep d. For this plot, do the log transformation using a scale verb in ggplot. Do make your background look like this one. Question to answer in a comment: Why was a log transformation used? Try doing it without the transformation, and explain why the transformation allows us to interpret the relationship in a better way. Brain Weight by Body Weight (log scale) 1e+01 - Brain Weight (log scale) 10-03- 1e.01 Body Weight (log scale) 3. Write the R code that will create each of the plots below. You will need ggplot2 code, and you may also need dplyr code for some plots, to get the data just right. You do not have to have the exact same colors as my plotswand it's ok if your title is centered, rather than left-justified, but your plots should look very close to mine. See notes for each plot, e.g., plot (d) asks for you to comment on the plot, too. Again, please use comments to state which homework question your code is answering, e.g.: # Question 3, part a a. Note title (with quotes around vore) and style of bars. Conservation status of animal by "vore" 1.00 - 0.75 - conservation Od domesticated count 0.25 - 0.00 - carni herbi insecti omni vore b. Note the title and the y-axis label. Total Hours of Sleep by "vore" Total Hours of Sleep vore B carni herbi B insecti omni herbi insecti omni vore c. Note there are no 'NA' vores. Total Hours of Sleep by "vore" carni herbi vore carni density herbi insecti omni insecti omni 15 Total Hours of Sleep d. For this plot, do the log transformation using a scale verb in ggplot. Do make your background look like this one. Question to answer in a comment: Why was a log transformation used? Try doing it without the transformation, and explain why the transformation allows us to interpret the relationship in a better way. Brain Weight by Body Weight (log scale) 1e+01 - Brain Weight (log scale) 10-03- 1e.01 Body Weight (log scale)
Step by Step Solution
There are 3 Steps involved in it

Get step-by-step solutions from verified subject matter experts