

Question: 39.6 July The table gives the average monthly temperature y in a certain county in Maryland, where t corresponds to the month. Use t=1
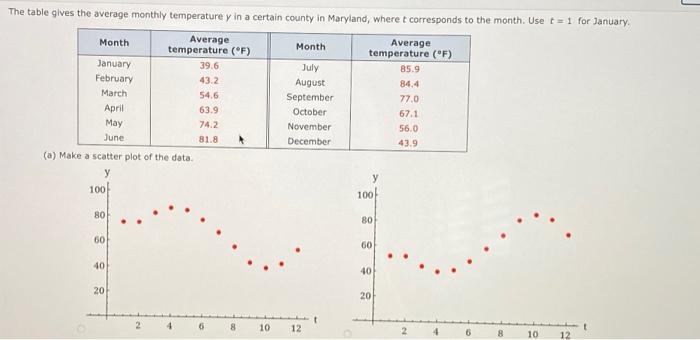

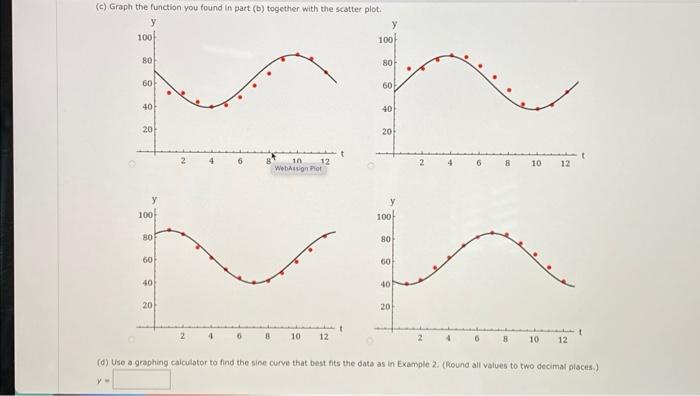
39.6 July The table gives the average monthly temperature y in a certain county in Maryland, where t corresponds to the month. Use t=1 for January. Month January Average temperature (F) Month Average temperature (F) 85.9 February 43.2 August 84.4 March 54.6 September 77.0 April 63.9 October 67.1 May 74.2 November 56.0 June 81.8 December 43.9 (a) Make a scatter plot of the data. y 100 80 60 40 20 20 2 4 6 8 10 12 y 100 80 60 40 20 t 8 10 12 (b) Find a cosine function of the form ya cos(a(t-c)) + b that models the data, as in Example 1. y = (c) Graph the function you found in part (b) together with the scatter plot. y 100 80 60 40 20 100 80 60 40 20 2 10 WebAssign Plot 12 10 12 y 100 80 60 40 20 100 80 60 40 20 10 12 6 8 10 12 (d) Use a graphing calculator to find the sine curve that best fits the data as in Example 2. (Round all values to two decimal places.) y-
Step by Step Solution
There are 3 Steps involved in it

Get step-by-step solutions from verified subject matter experts