

Question: ( 4 1 ) ) 3 . The drip diagram is showing us where the object is after each second that it has moved. The
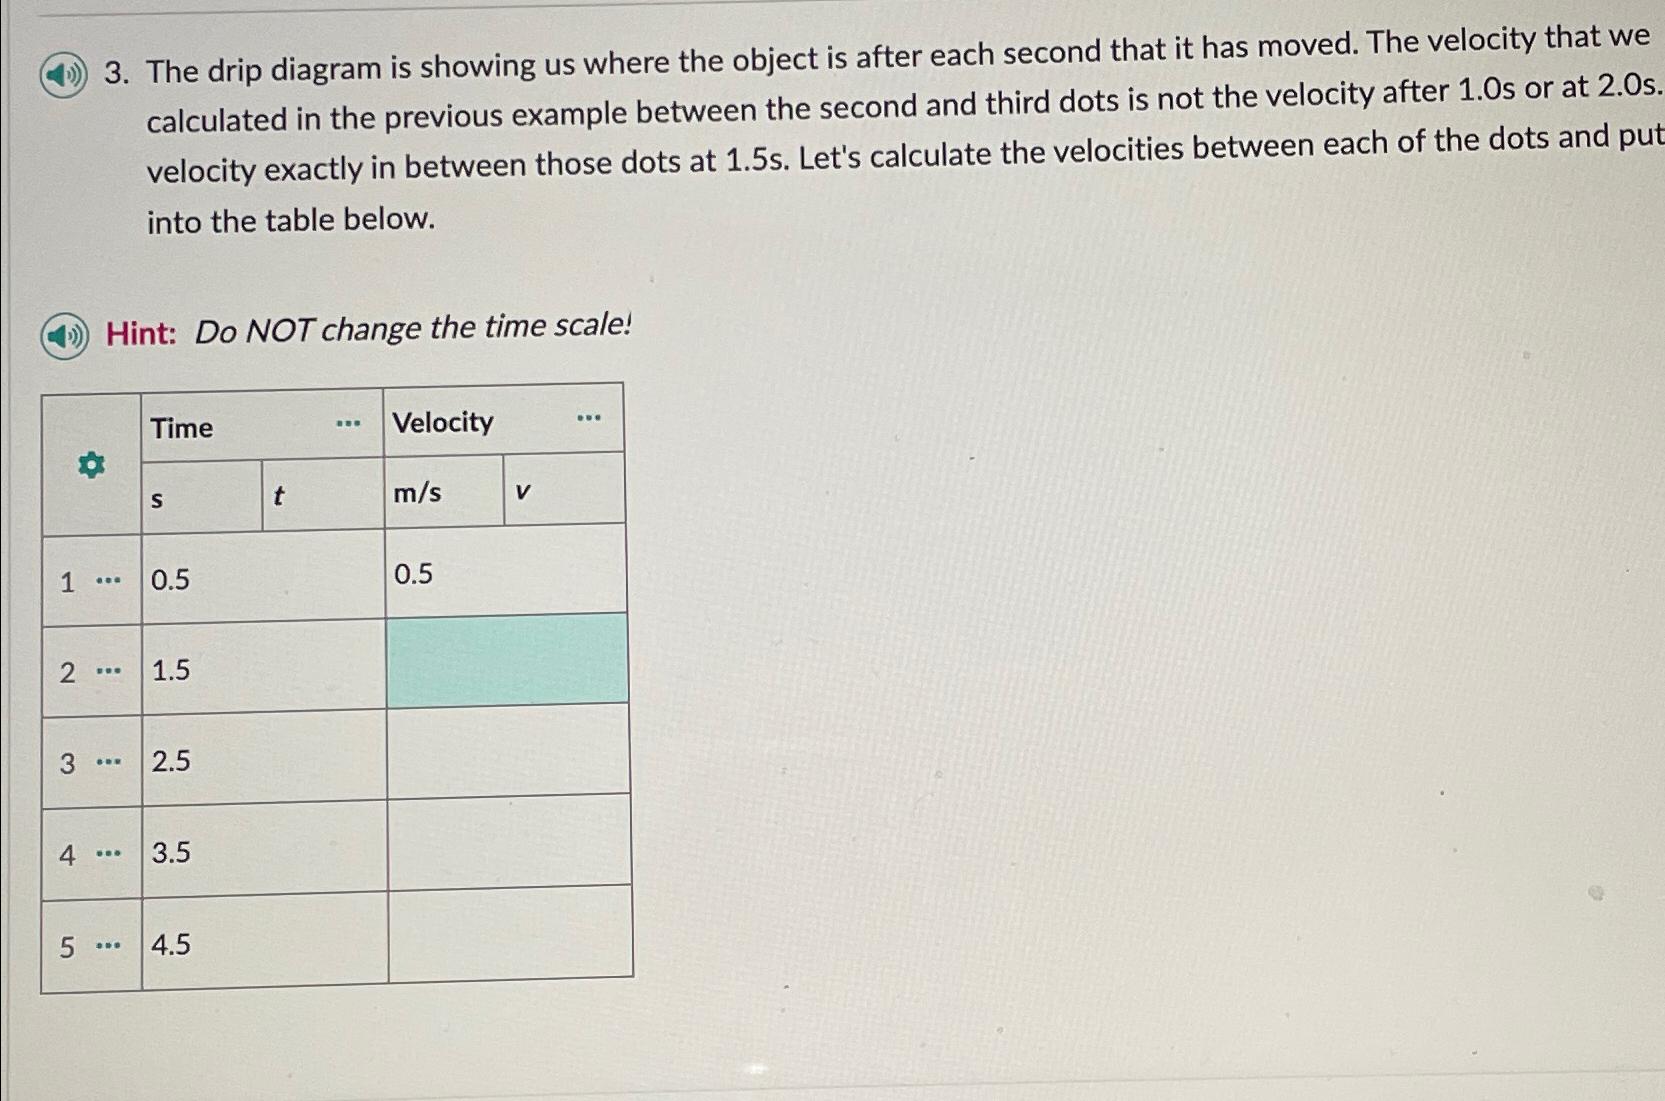
The drip diagram is showing us where the object is after each second that it has moved. The velocity that we calculated in the previous example between the second and third dots is not the velocity after s or at velocity exactly in between those dots at Let's calculate the velocities between each of the dots and put into the table below.
Hint: Do NOT change the time scale!
tableTime,Velocitys
Step by Step Solution
There are 3 Steps involved in it
1 Expert Approved Answer
Step: 1 Unlock

Question Has Been Solved by an Expert!
Get step-by-step solutions from verified subject matter experts
Step: 2 Unlock
Step: 3 Unlock