

Question: 4. Supply - Basic concepts Complete the following table by selecting the term that matches each definition. Quantity Supply Supply Law of Supplied Curve
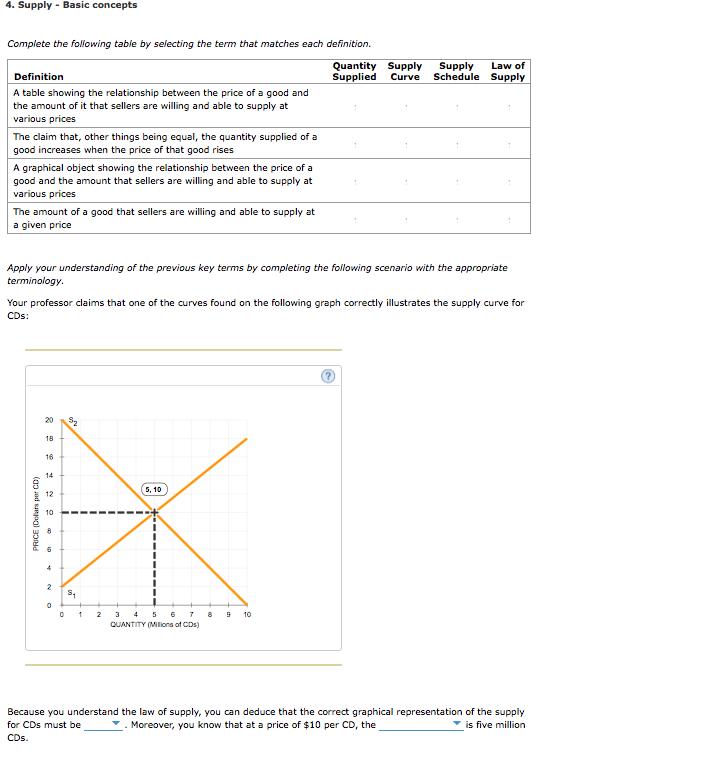
4. Supply - Basic concepts Complete the following table by selecting the term that matches each definition. Quantity Supply Supply Law of Supplied Curve Schedule Supply Definition A table showing the relationship between the price of a good and the amount of it that sellers are willing and able to supply at various prices The claim that, other things being equal, the quantity supplied of a good increases when the price of that good rises A graphical object showing the relationship between the price of a good and the amount that sellers are willing and able to supply at various prices The amount of a good that sellers are willing and able to supply at a given price Apply your understanding of the previous key terms by completing the following scenario with the appropriate terminology. Your professor claims that one of the curves found on the following graph correctly illustrates the supply curve for CDs: 20 5 18 (5,10 S 0 1 10 3 4 5 6 7 QUANTITY (Milions of CDs) Because you understand the law of supply, you can deduce that the correct graphical representation of the supply for CDs must be Moreover, you know that at a price of $10 per CD, the is five million CDs. PRICE (Dollars per CD) 8 2 22. 16 14 12 10 8 6 4 2 2 8 9
Step by Step Solution
3.50 Rating (150 Votes )
There are 3 Steps involved in it
Solution Because you understand the law of supply you can deduce that the correct graphical rep... View full answer

Get step-by-step solutions from verified subject matter experts