

Question: 4). The above data was used to perform a regression analvis with the results shown in the graph. The values for the X variable used
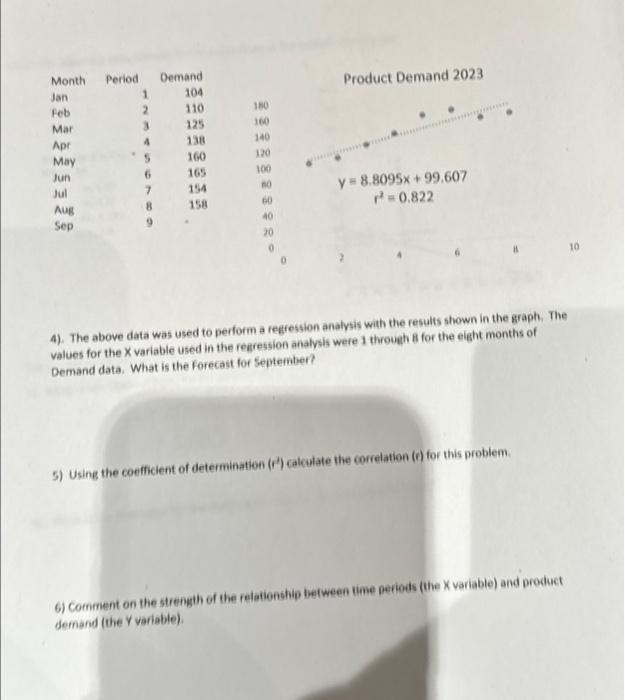
4). The above data was used to perform a regression analvis with the results shown in the graph. The values for the X variable used in the regression analvis were 1 through 8 for the eight months of Demand data. What is the forecast for September? 5) Using the coefficient of determination ( f2) calculate the correlation (f) for this problem. 6) Comment on the strength of the relationship between time periods (the x variable) and product demand (the Y variable). 4). The above data was used to perform a regression analvis with the results shown in the graph. The values for the X variable used in the regression analvis were 1 through 8 for the eight months of Demand data. What is the forecast for September? 5) Using the coefficient of determination ( f2) calculate the correlation (f) for this problem. 6) Comment on the strength of the relationship between time periods (the x variable) and product demand (the Y variable)
Step by Step Solution
There are 3 Steps involved in it

Get step-by-step solutions from verified subject matter experts