

Question: 4). The above data was used to perform a regression analysis with the results shown in the graph. The values for the X variable used
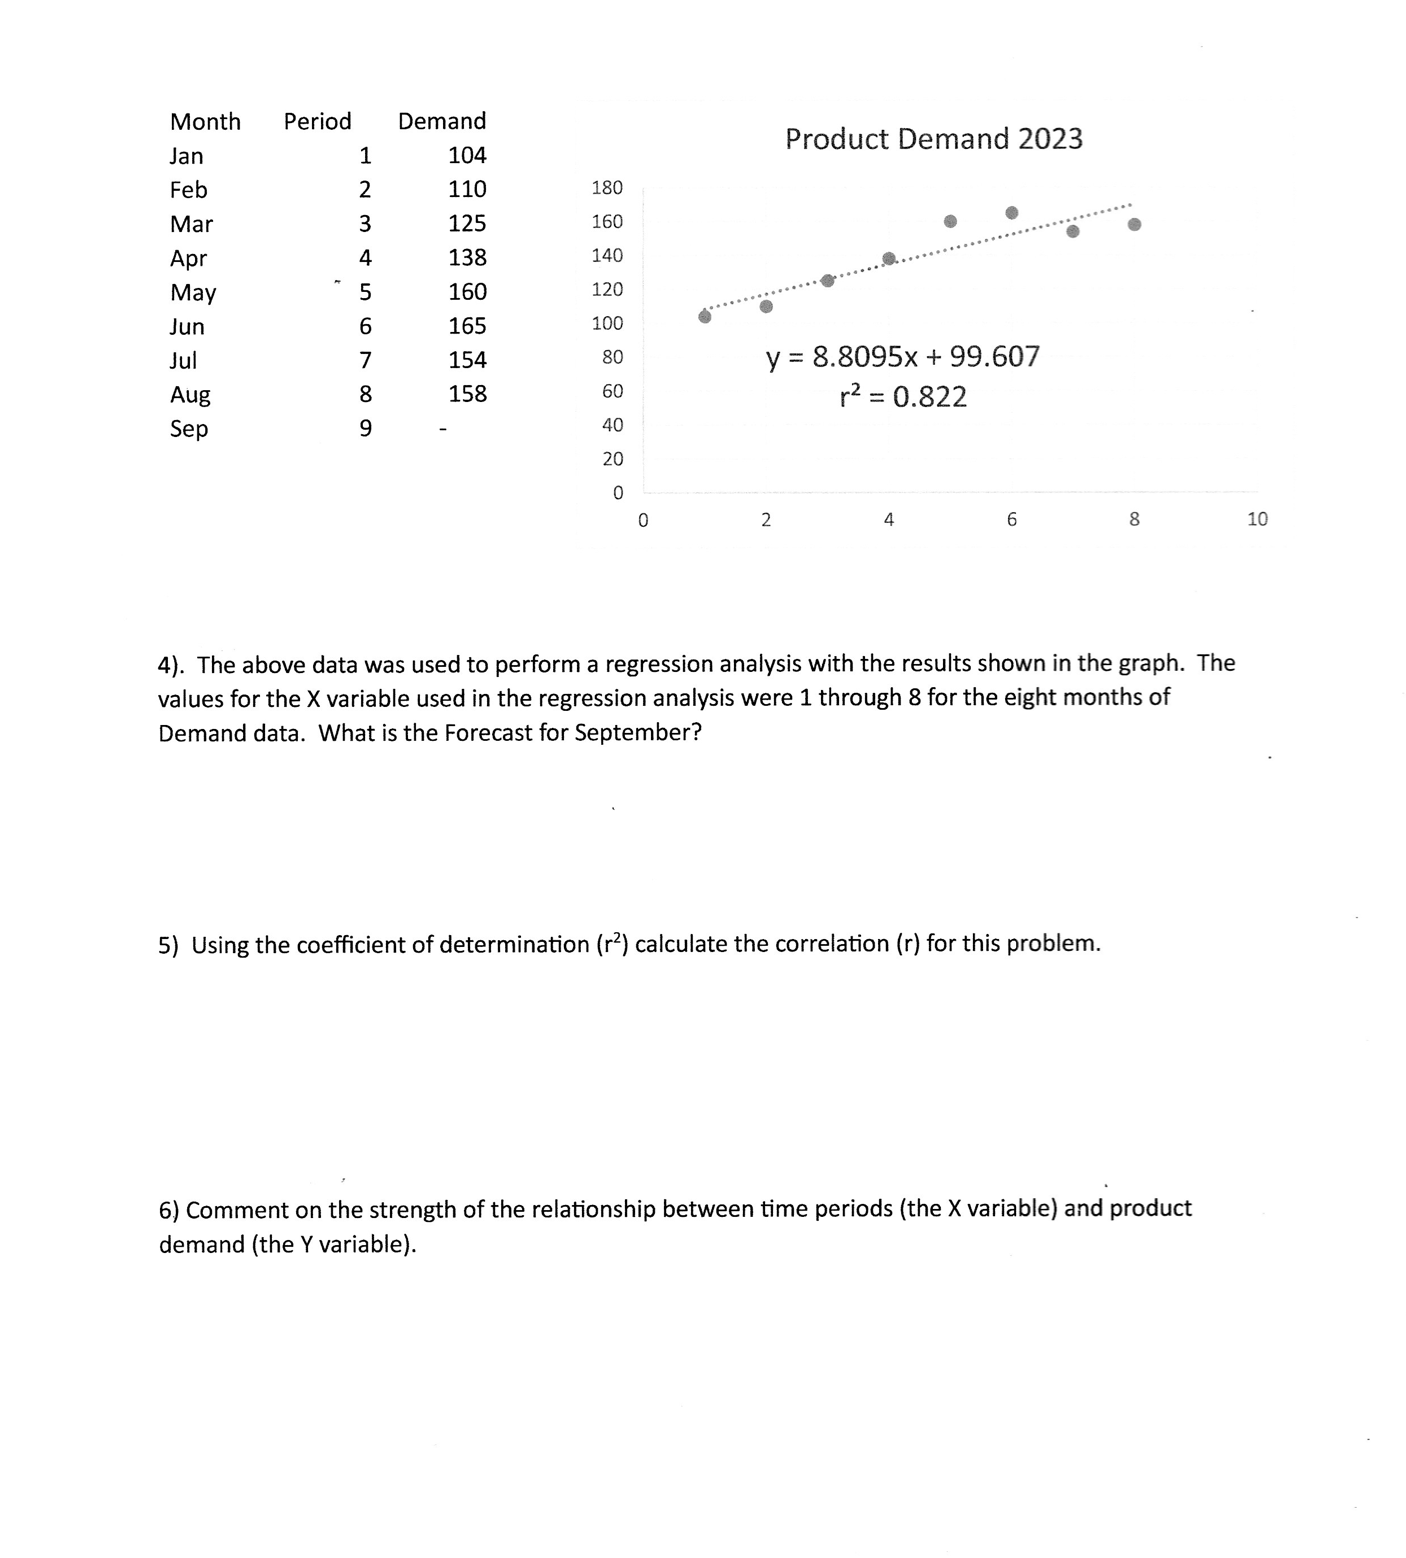
4). The above data was used to perform a regression analysis with the results shown in the graph. The values for the X variable used in the regression analysis were 1 through 8 for the eight months of Demand data. What is the Forecast for September? 5) Using the coefficient of determination (r2) calculate the correlation (r) for this problem. 6) Comment on the strength of the relationship between time periods (the X variable) and product demand (the Y variable)
Step by Step Solution
There are 3 Steps involved in it
1 Expert Approved Answer
Step: 1 Unlock

Question Has Been Solved by an Expert!
Get step-by-step solutions from verified subject matter experts
Step: 2 Unlock
Step: 3 Unlock