

Question: 4). The above data was used to perform a regression analysis with the results shown in the graph. The values for the X variable used
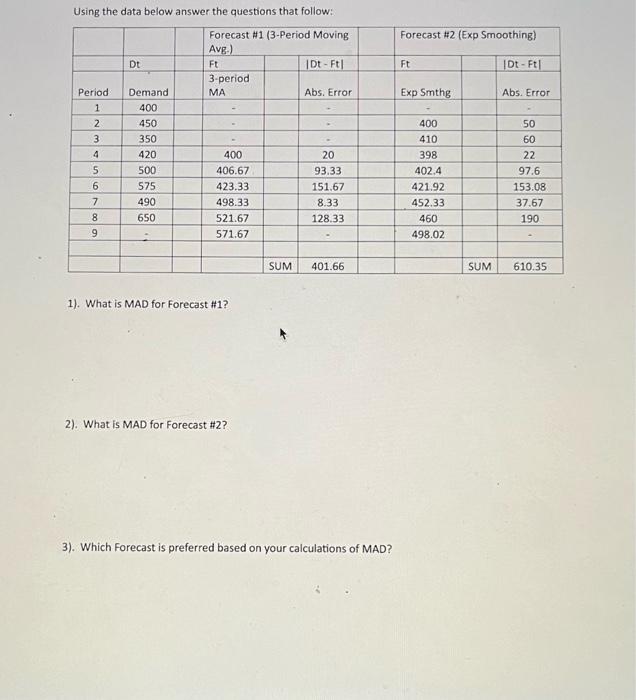
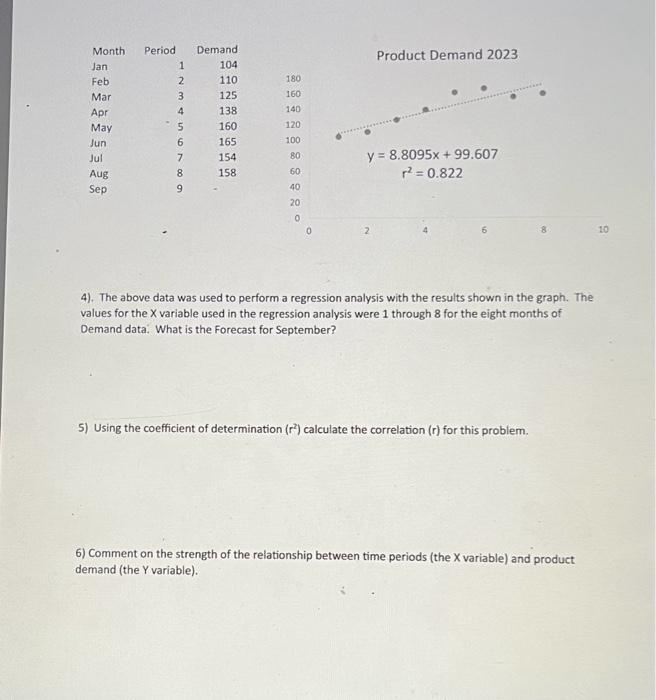
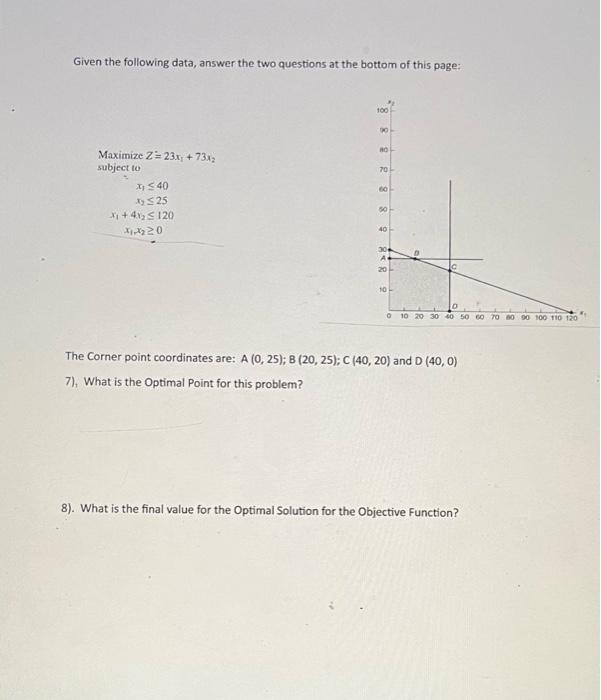
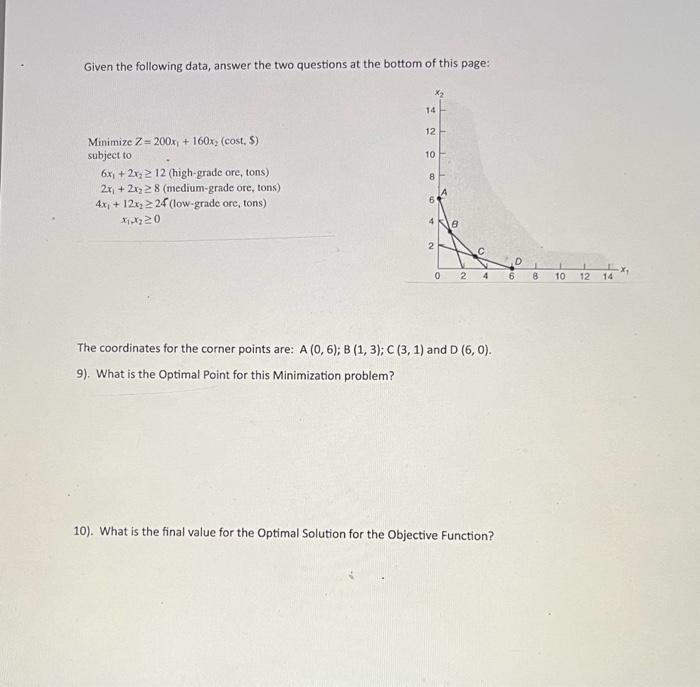
4). The above data was used to perform a regression analysis with the results shown in the graph. The values for the X variable used in the regression analysis were 1 through 8 for the eight months of Demand data. What is the Forecast for September? 5) Using the coefficient of determination (r2) calculate the correlation ( r ) for this problem. 6) Comment on the strength of the relationship between time periods (the X variable) and product demand (the Y variable). Using the data below answer the questions that follow: 1). What is MAD for Forecast \#1? 2). What is MAD for Forecast #2 ? 3). Which Forecast is preferred based on your calculations of MAD? Given the following data, answer the two questions at the bottom of this page: MaximizeZsubjecttox1x2x1+4x2x1,x2=23x1+73x240251200 The Corner point coordinates are: A(0,25);B(20,25);C(40,20) and D(40,0) 7), What is the Optimal Point for this problem? 8). What is the final value for the Optimal Solution for the Objective Function? Given the following data, answer the two questions at the bottom of this page: MinimizeZsubjectto6x1+2x22x1+2x24x1+12x2x1,x2=200x1+160x2(cost,$)12(high-gradeore,tons)8(medium-gradeore,tons)24(low-gradeore,tons)0 The coordinates for the corner points are: A(0,6);B(1,3);C(3,1) and D(6,0). 9). What is the Optimal Point for this Minimization problem? 10). What is the final value for the Optimal Solution for the Objective Function
Step by Step Solution
There are 3 Steps involved in it

Get step-by-step solutions from verified subject matter experts