

Question: 4. The data shown in Figure 1 represent the volume measurements of Poly vinyl Acetate (PVAc) sample upon cooling from the liquid to the glassy
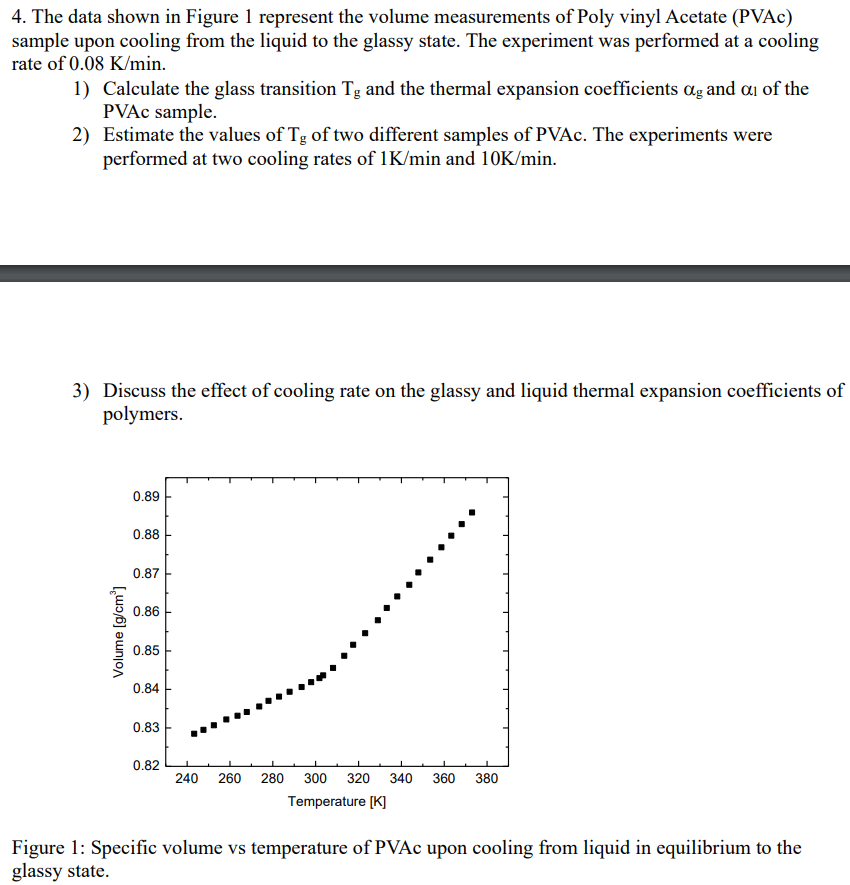
4. The data shown in Figure 1 represent the volume measurements of Poly vinyl Acetate (PVAc) sample upon cooling from the liquid to the glassy state. The experiment was performed at a cooling rate of 0.08 K/min. 1) Calculate the glass transition Tg and the thermal expansion coefficients Ag and ai of the PVAc sample. 2) Estimate the values of Tg of two different samples of PVAc. The experiments were performed at two cooling rates of 1K/min and 10K/min. 3) Discuss the effect of cooling rate on the glassy and liquid thermal expansion coefficients of polymers. 0.89 0.88 0.87 0.86 Volume (g/cm) 0.85 0.84 0.83 0.82 240 260 280 300 320 340 360 380 Temperature [K] Figure 1: Specific volume vs temperature of PVAc upon cooling from liquid in equilibrium to the glassy state
Step by Step Solution
There are 3 Steps involved in it

Get step-by-step solutions from verified subject matter experts