

Question: 4. The graph was prepared to use linear programming; it pictures four constraints on resources shared by production of Windows and Doors. The objective
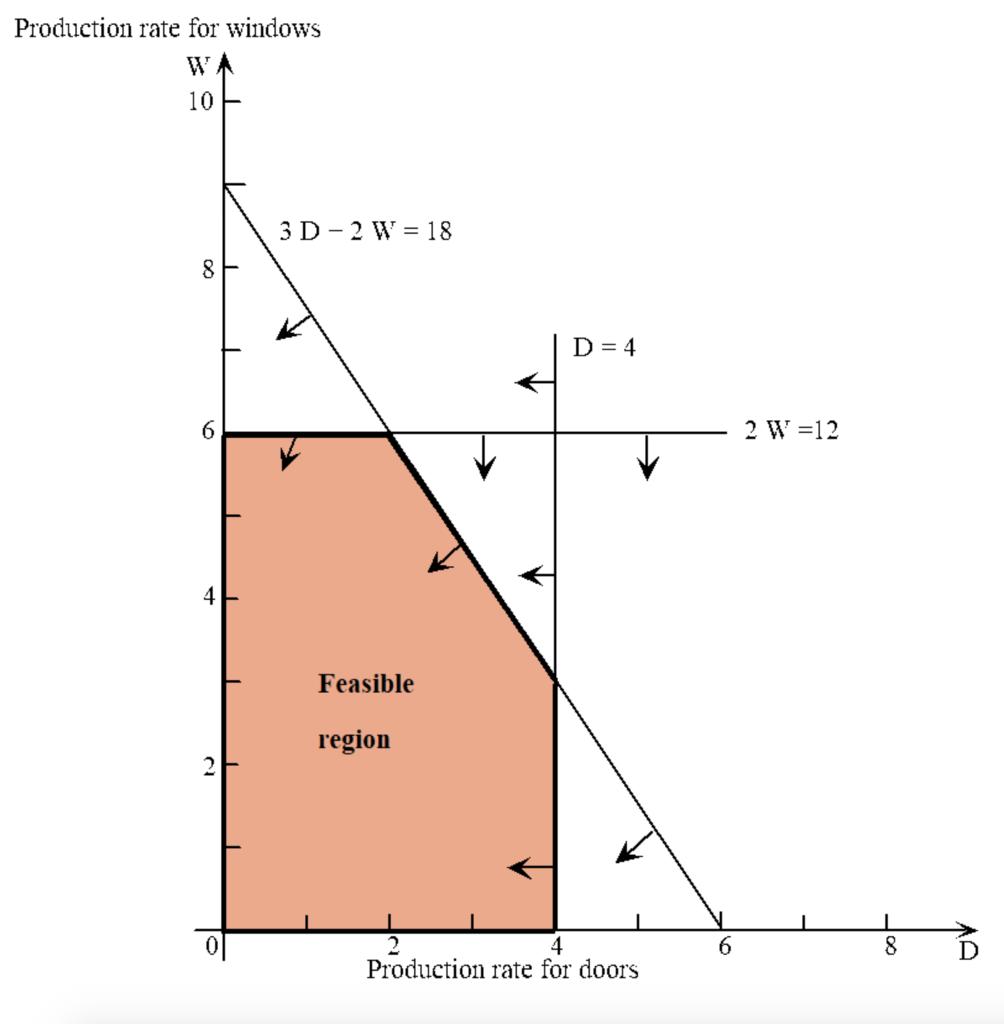
4. The graph was prepared to use linear programming; it pictures four constraints on resources shared by production of Windows and Doors. The objective is to maximize profit in hundreds of dollars ($00). Using this measure, the profit contribution of each door is 9 and the profit contribution of each window is 5. a. Compute the profit of each feasible alternative. b. Find the optimal (best) solution. c. Write your solution in words. Production rate for windows W 10 8 4 3D 2 W 18 Feasible region 2 4 D = 4 Production rate for doors. 2 W =12 6 8 D
Step by Step Solution
There are 3 Steps involved in it
1 Expert Approved Answer
Step: 1 Unlock

Question Has Been Solved by an Expert!
Get step-by-step solutions from verified subject matter experts
Step: 2 Unlock
Step: 3 Unlock