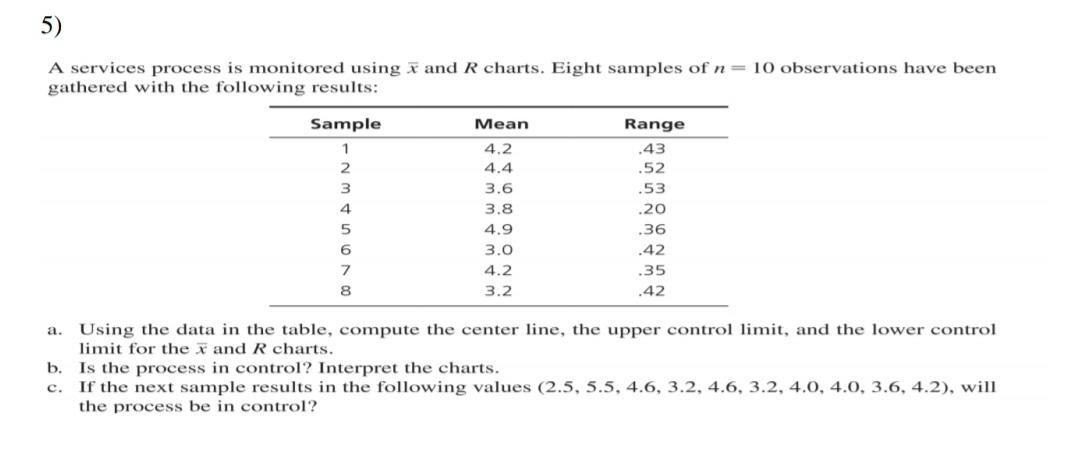
Question: 5) A services process is monitored using i and R charts. Eight samples of n= 10 observations have been gathered with the following results: Range

5) A services process is monitored using i and R

5) A services process is monitored using i and R charts. Eight samples of n= 10 observations have been gathered with the following results: Range Mean 4.2 4.4 Sample 1 2 3 4 5 3.6 3.8 4.9 3.0 4.2 3.2 .43 .52 .53 .20 .36 .42 .35 .42 6 7 8 a. Using the data in the table, compute the center line, the upper control limit, and the lower control limit for the x and R charts. b. Is the process in control? Interpret the charts. c. If the next sample results in the following values (2.5, 5.5, 4.6, 3.2, 4.6, 3.2, 4.0, 4.0, 3.6, 4.2), will the process be in control

Step by Step Solution

There are 3 Steps involved in it

1 Expert Approved Answer
Step: 1 Unlock blur-text-image
Question Has Been Solved by an Expert!

Get step-by-step solutions from verified subject matter experts

Step: 2 Unlock
Step: 3 Unlock

Students Have Also Explored These Related General Management Questions!