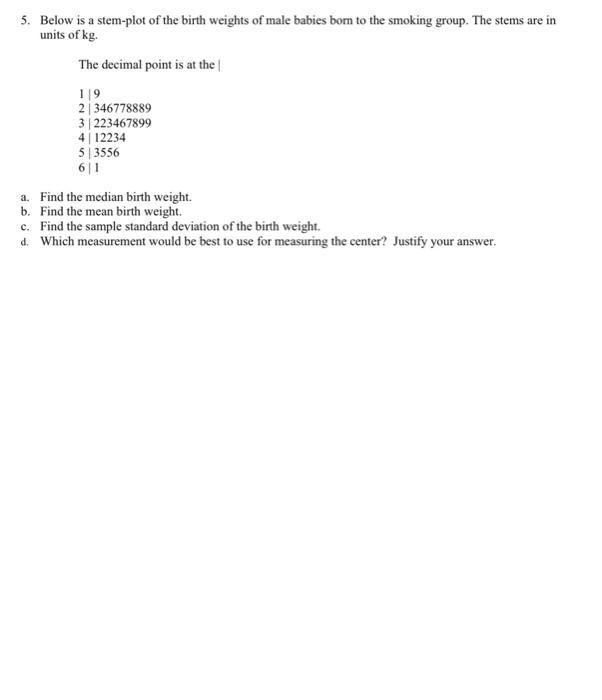
5. Below is a stem-plot of the birth weights of male babies bom to the smoking...
Fantastic news! We've Found the answer you've been seeking!
Question:
Transcribed Image Text:
5. Below is a stem-plot of the birth weights of male babies bom to the smoking group. The stems are in units of kg. The decimal point is at the 1|9 2346778889 3223467899 412234 513556 6|1 a. Find the median birth weight. b. Find the mean birth weight. c. Find the sample standard deviation of the birth weight. d. Which measurement would be best to use for measuring the center? Justify your answer. 6. A student would like to study the relationship between the mileage per gallon (MPG) and horsepower of some fuel efficient automobiles in a certain year. Below are the information this student collected. Answer the following questions. You can use R to answer all of these questions, no need to do by hand. Car Toyota Prius Hyundai Kona Kia Niro Honda accord Volkswagen Jetta Subaru Impreza Hyundai Elantra Honda Civic Toyota Camry Toyota Corolla MPG (y) 53 32 45 32 33 35 36 40 35 38 Horsepower (x, in hp) 121 170 140 210 158 198 134 170 215 152 a. Draw a scatterplot of the data. Describe the relationship between MPG and Horsepower. b. Determine the covariance and correlation coefficient (r) between MPG and Horsepower. c. Suppose we would like to predict MPG based on a car's horsepower. Find the least-squares equation for the prediction. d. If a car's horsepower is 180 hp, what is the predicted MPG? e. Determine the coefficient of determination (R). Give the interpretation of this value. f. If a car's horsepower is 170 hp with MPG 39, what is the residual? 5. Below is a stem-plot of the birth weights of male babies bom to the smoking group. The stems are in units of kg. The decimal point is at the 1|9 2346778889 3223467899 412234 513556 6|1 a. Find the median birth weight. b. Find the mean birth weight. c. Find the sample standard deviation of the birth weight. d. Which measurement would be best to use for measuring the center? Justify your answer. 6. A student would like to study the relationship between the mileage per gallon (MPG) and horsepower of some fuel efficient automobiles in a certain year. Below are the information this student collected. Answer the following questions. You can use R to answer all of these questions, no need to do by hand. Car Toyota Prius Hyundai Kona Kia Niro Honda accord Volkswagen Jetta Subaru Impreza Hyundai Elantra Honda Civic Toyota Camry Toyota Corolla MPG (y) 53 32 45 32 33 35 36 40 35 38 Horsepower (x, in hp) 121 170 140 210 158 198 134 170 215 152 a. Draw a scatterplot of the data. Describe the relationship between MPG and Horsepower. b. Determine the covariance and correlation coefficient (r) between MPG and Horsepower. c. Suppose we would like to predict MPG based on a car's horsepower. Find the least-squares equation for the prediction. d. If a car's horsepower is 180 hp, what is the predicted MPG? e. Determine the coefficient of determination (R). Give the interpretation of this value. f. If a car's horsepower is 170 hp with MPG 39, what is the residual? 5. Below is a stem-plot of the birth weights of male babies bom to the smoking group. The stems are in units of kg. The decimal point is at the 1|9 2346778889 3223467899 412234 513556 6|1 a. Find the median birth weight. b. Find the mean birth weight. c. Find the sample standard deviation of the birth weight. d. Which measurement would be best to use for measuring the center? Justify your answer. 6. A student would like to study the relationship between the mileage per gallon (MPG) and horsepower of some fuel efficient automobiles in a certain year. Below are the information this student collected. Answer the following questions. You can use R to answer all of these questions, no need to do by hand. Car Toyota Prius Hyundai Kona Kia Niro Honda accord Volkswagen Jetta Subaru Impreza Hyundai Elantra Honda Civic Toyota Camry Toyota Corolla MPG (y) 53 32 45 32 33 35 36 40 35 38 Horsepower (x, in hp) 121 170 140 210 158 198 134 170 215 152 a. Draw a scatterplot of the data. Describe the relationship between MPG and Horsepower. b. Determine the covariance and correlation coefficient (r) between MPG and Horsepower. c. Suppose we would like to predict MPG based on a car's horsepower. Find the least-squares equation for the prediction. d. If a car's horsepower is 180 hp, what is the predicted MPG? e. Determine the coefficient of determination (R). Give the interpretation of this value. f. If a car's horsepower is 170 hp with MPG 39, what is the residual? 5. Below is a stem-plot of the birth weights of male babies bom to the smoking group. The stems are in units of kg. The decimal point is at the 1|9 2346778889 3223467899 412234 513556 6|1 a. Find the median birth weight. b. Find the mean birth weight. c. Find the sample standard deviation of the birth weight. d. Which measurement would be best to use for measuring the center? Justify your answer. 6. A student would like to study the relationship between the mileage per gallon (MPG) and horsepower of some fuel efficient automobiles in a certain year. Below are the information this student collected. Answer the following questions. You can use R to answer all of these questions, no need to do by hand. Car Toyota Prius Hyundai Kona Kia Niro Honda accord Volkswagen Jetta Subaru Impreza Hyundai Elantra Honda Civic Toyota Camry Toyota Corolla MPG (y) 53 32 45 32 33 35 36 40 35 38 Horsepower (x, in hp) 121 170 140 210 158 198 134 170 215 152 a. Draw a scatterplot of the data. Describe the relationship between MPG and Horsepower. b. Determine the covariance and correlation coefficient (r) between MPG and Horsepower. c. Suppose we would like to predict MPG based on a car's horsepower. Find the least-squares equation for the prediction. d. If a car's horsepower is 180 hp, what is the predicted MPG? e. Determine the coefficient of determination (R). Give the interpretation of this value. f. If a car's horsepower is 170 hp with MPG 39, what is the residual?
Expert Answer:
Answer rating: 100% (QA)
Solution a To find the median birth weight we need to arrange the data in ascending order 192 193 19... View the full answer
Related Book For
Posted Date:
Students also viewed these accounting questions
-
When comparing two distributions, it would be best to use relative frequency histograms rather than frequency histograms when a. The distributions have different shapes. b. The distributions have...
-
10. Which weak acid would be best to use when preparing a buffer solution with a pH of 9.30? Which weak acid would be best to use when preparing a buffer solution with a pH of 9.30? An acid with K =...
-
The mean birth weight of male babies born to 121 mothers taking a vitamin supplement is 3.67 kilograms with a standard deviation of 0.66 kilogram (based on data from the New York State Department of...
-
Your firm needs to decide how much to ship along each route AND which of the new stores to open. Opening Gamma incurs a fixed cost of $225. Opening Omega incurs a fixed cost of $200. The relevant...
-
To illustrate the notion that people are rational and respond to incentives, consider an experiment conducted by the managers of a Chinese factory that produces electronic products such as GPS...
-
The Moraine Company has net income of $158,230. There are currently 28.45 days sales in receivables. Total assets are $804,320, total receivables are $155,218, and the debt-equity ratio is .25. What...
-
Consider an experiment that selects a cell phone camera and records the recycle time of a flash (the time taken to ready the camera for another flash). The possible values for this time depend on the...
-
Golden State Enterprises provides consulting services throughout California and uses a job-order costing system to accumulate the cost of client projects. Traceable costs are charged directly to...
-
What is the required annual mortgage constant for a 10 percent, 25-year loan, if payments are made annually?
-
Block C starts from rest and moves down with a constant acceleration. Knowing that after block A has moved 0.5 m its velocity is 0.2 m/s, determine(a) The accelerations of A and C,(b) The velocity...
-
1. Explain briefly the purpose of proposed auditor communicating with the predecessor auditors, 2. List three matters about which the proposed auditor should seek information.
-
Given the matrices in Problems 32-35, perform elementary row operations to obtain a 1 in the third row, third column without changing the entries in the first two columns....
-
Given the matrices in Problems 20-23, perform elementary row operations to obtain zeros under the 1 in the first column. Answers may vary. \([C]=\left[\begin{array}{rrr:r}1 & 2 & 4 & 1 \\ -2 & 5 & 0...
-
Suppose there are ten serious, but almost indistinguishable, candidates for a U.S. presidential primary. Also suppose that at the last possible minute a very radical candidate enters the race. He is...
-
A farmer has 500 acres on which to plant two crops: corn and wheat. To produce these crops, there are certain expenses: After the harvest, the farmer must store the crops while awaiting proper market...
-
Given the matrices in Problems 32-35, perform elementary row operations to obtain a 1 in the third row, third column without changing the entries in the first two columns....
-
Polycorp is considering a new project. The project has beta (B) that is twice that of the firm's existing assets (projects). Polycorp's existing assets have a required return (cost of capital) of 9%,...
-
Data on weekday exercise time for 20 females, consistent with summary quantities given in the paper An Ecological Momentary Assessment of the Physical Activity and Sedentary Behaviour Patterns of...
-
Construct a Pareto chart depicting the distribution of train derailments from Exercise 30 in Section 2-2.
-
Data Set 13 in Appendix B lists measured voltage amounts supplied directly to the author?s home. The Central Hudson power supply company states that it has a target power supply of 120 volts. Using...
-
The normal quantile plot represents the last two digits of telephone numbers of survey subjects. Examine the normal quantile plot and determine whether it depicts sample data from a population with a...
-
What are some of the key reasons for project failure?
-
What are the main phases in the PMI's Project Management Body of Knowledge (PMBOK) life cycle? What is the purpose of each of these phases?
-
What is meant by an integrative (holistic) approach to project management? Why is this approach important in today's environment?
Study smarter with the SolutionInn App