

Question: The normal quantile plot represents the last two digits of telephone numbers of survey subjects. Examine the normal quantile plot and determine whether it depicts
The normal quantile plot represents the last two digits of telephone numbers of survey subjects.
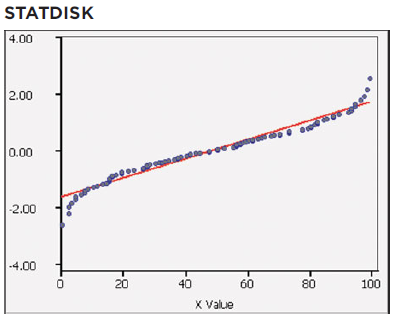
Examine the normal quantile plot and determine whether it depicts sample data from a population with a normal distribution.
STATDISK 4.00 2.00 0.00 2.00 -4.00 20 40 60 80 100 X Value
Step by Step Solution
★★★★★
3.29 Rating (155 Votes )
There are 3 Steps involved in it
1 Expert Approved Answer
Step: 1 Unlock

ANSWER Based on the provided normal quantile plot the data ... View full answer
Question Has Been Solved by an Expert!
Get step-by-step solutions from verified subject matter experts
Step: 2 Unlock
Step: 3 Unlock