

Question: 5 Plot the following data on mean and range charts and interpret the results. The sample size is four and the specification is 60.0 2.0.
5 Plot the following data on mean and range charts and interpret the results.
The sample size is four and the specification is 60.0 2.0.
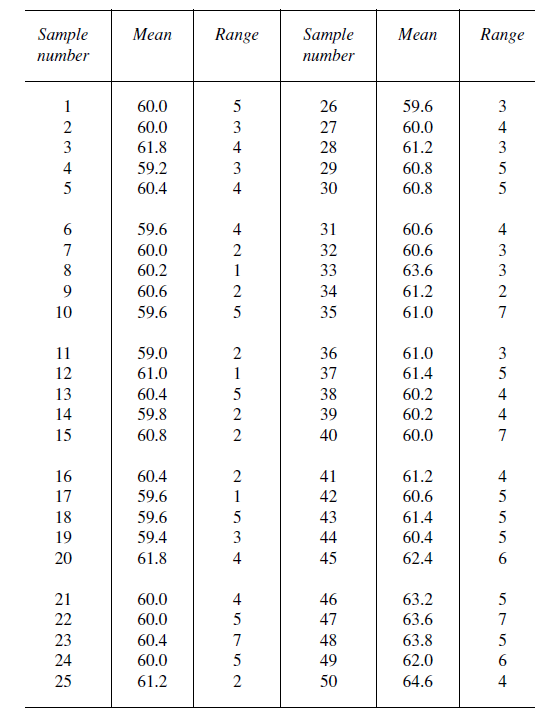
Sample Mean Range Sample Mean Range number number 60.0 26 59.6 60.0 27 60.0 61.8 AWAWU 28 61.2 59.2 29 60.8 60.4 30 60.8 59.6 31 60.6 60.0 32 60.6 60.2 JNWWA UN-NA 33 63.6 60.6 34 61.2 59.6 35 61.0 11 59.0 36 61.0 12 61.0 37 61.4 13 60.4 NNVEN 38 60.2 14 59.8 39 60.2 15 60.8 40 60.0 16 60.4 41 61.2 17 59.6 42 60.6 18 59.6 AQUIEN 43 61.4 19 59.4 44 60.4 20 61.8 45 62.4 21 60.0 46 63.2 22 60.0 47 63.6 23 60.4 48 63.8 24 60.0 49 62.0 25 61.2 50 64.6
Step by Step Solution
There are 3 Steps involved in it
1 Expert Approved Answer
Step: 1 Unlock

Question Has Been Solved by an Expert!
Get step-by-step solutions from verified subject matter experts
Step: 2 Unlock
Step: 3 Unlock